In order to get detailed browser logs, you need to create a HAR file and get screenshots of your browser console. To do that, please follow the steps below:
-
Open your web browser.
-
The screenshots below are prepared using Chrome but all browsers have similar functionality.
-
-
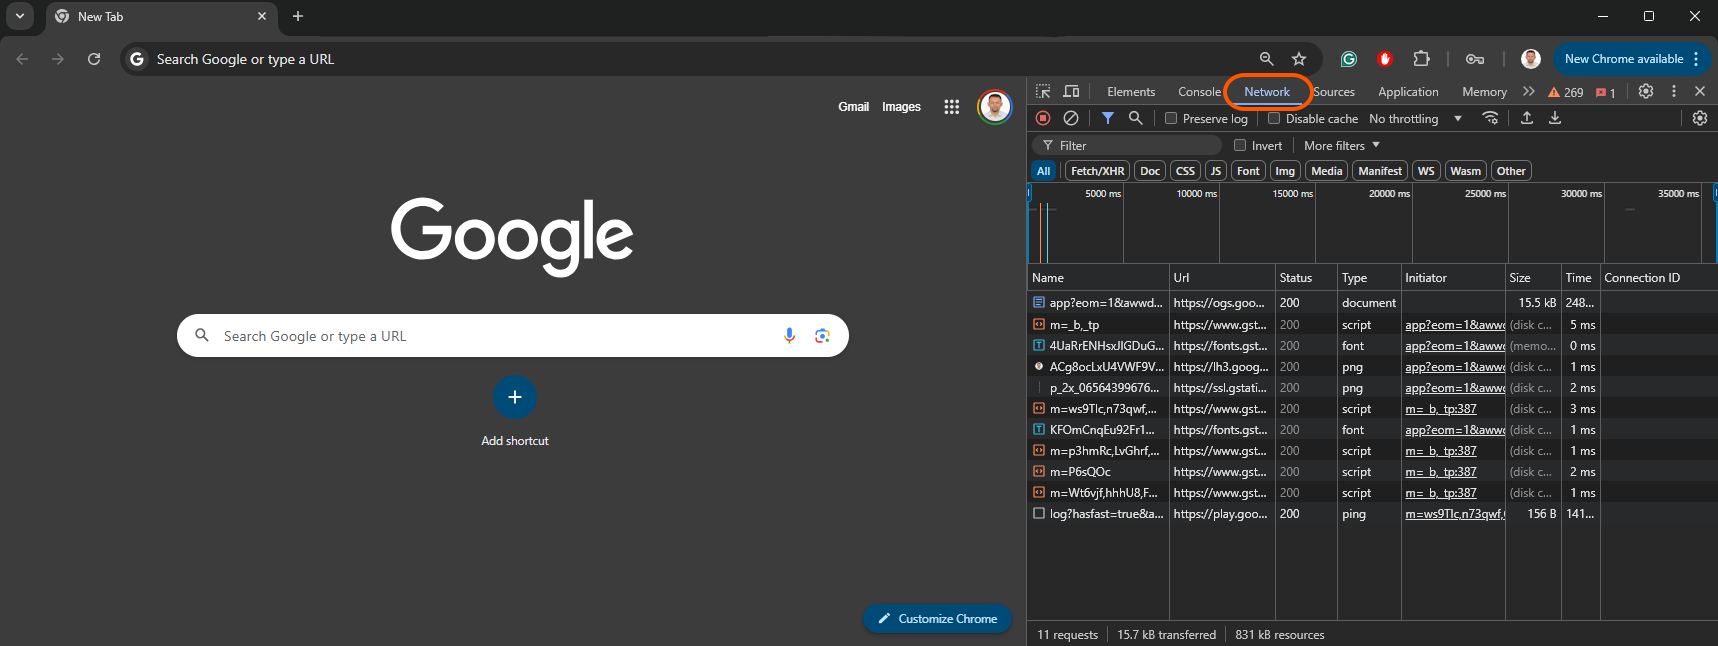
Open your browser's Developer Console (F12 in chrome) and Switch to Network tab.
-
-
Repeat the action that causes the problem.
-
If you are having problems opening the app page, then simply refresh the browser page.
-
If you need to inspect a specific problem, repeat the action that triggers the problem and confirm that the problem happened again.
-
-
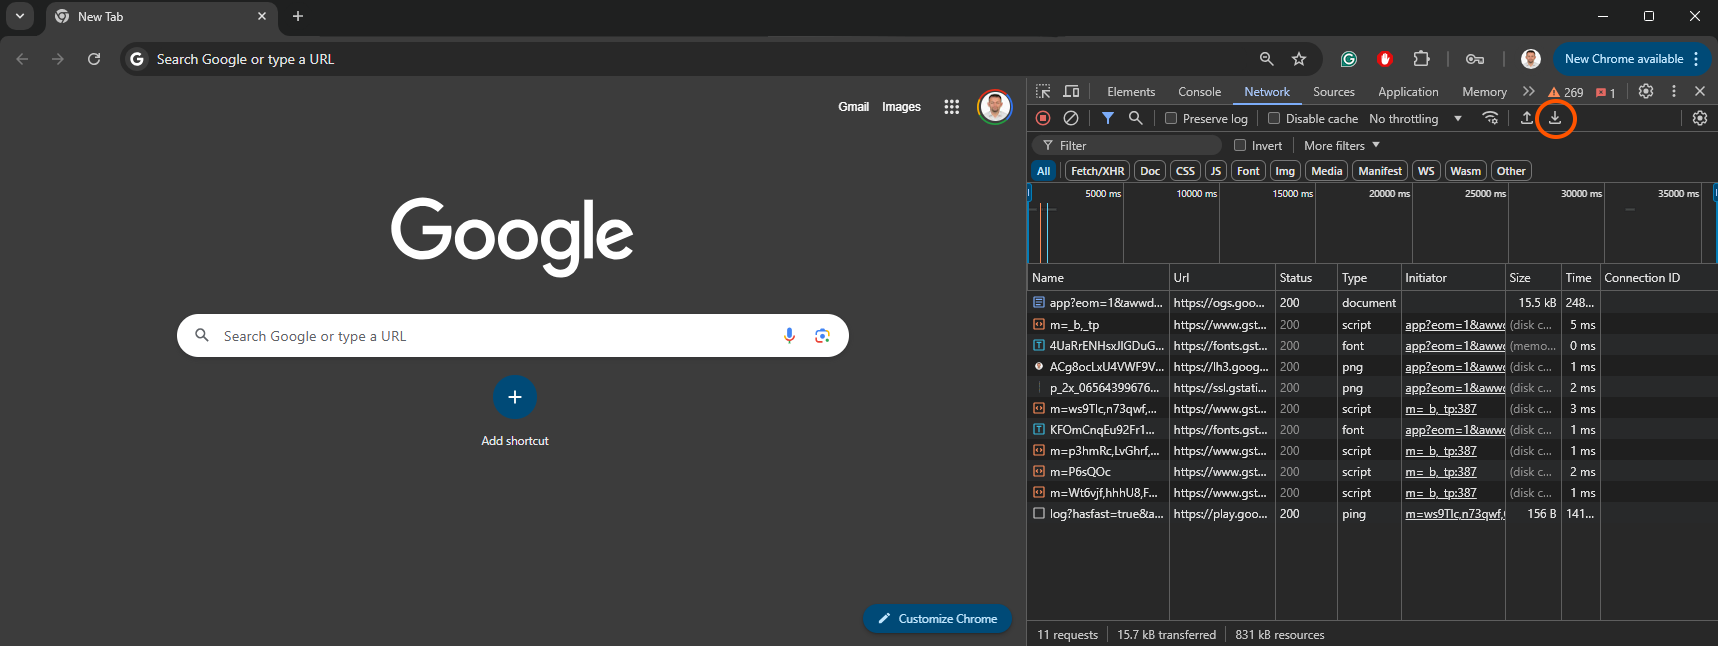
Download the network traffic as a HAR file
-
There is a Download HAR button in the Developer Console.
-
Compress the HAR file into a ZIP to avoid size limits as much as possible.
-
-
-
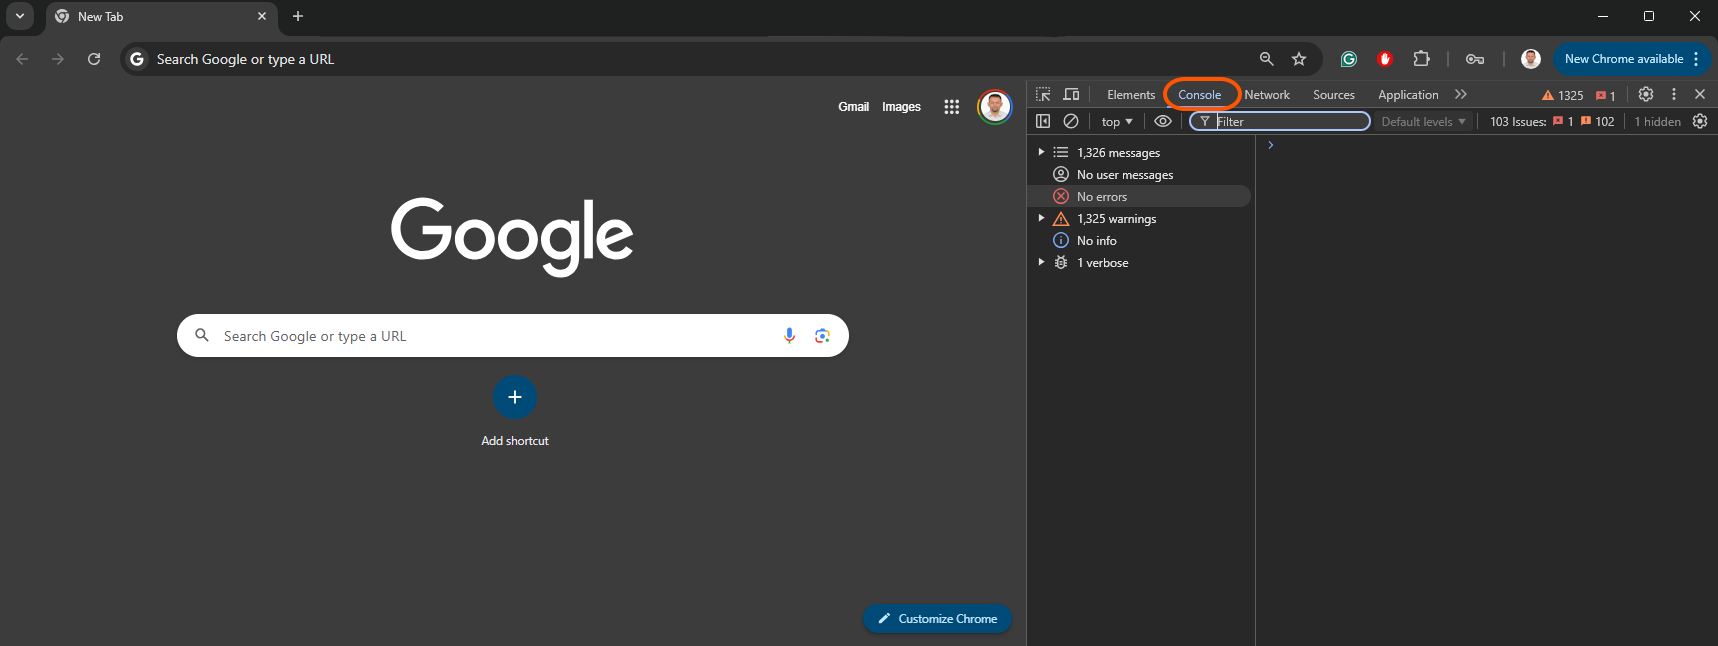
Switch to Console Tab
-
-
Take screenshots if there are any error or warning messages in this tab.
-
If there are many error and/or warning messages here, you might need to scroll down and get multiple screenshots.
-
-
Send the HAR file and screenshots to OBSS.