
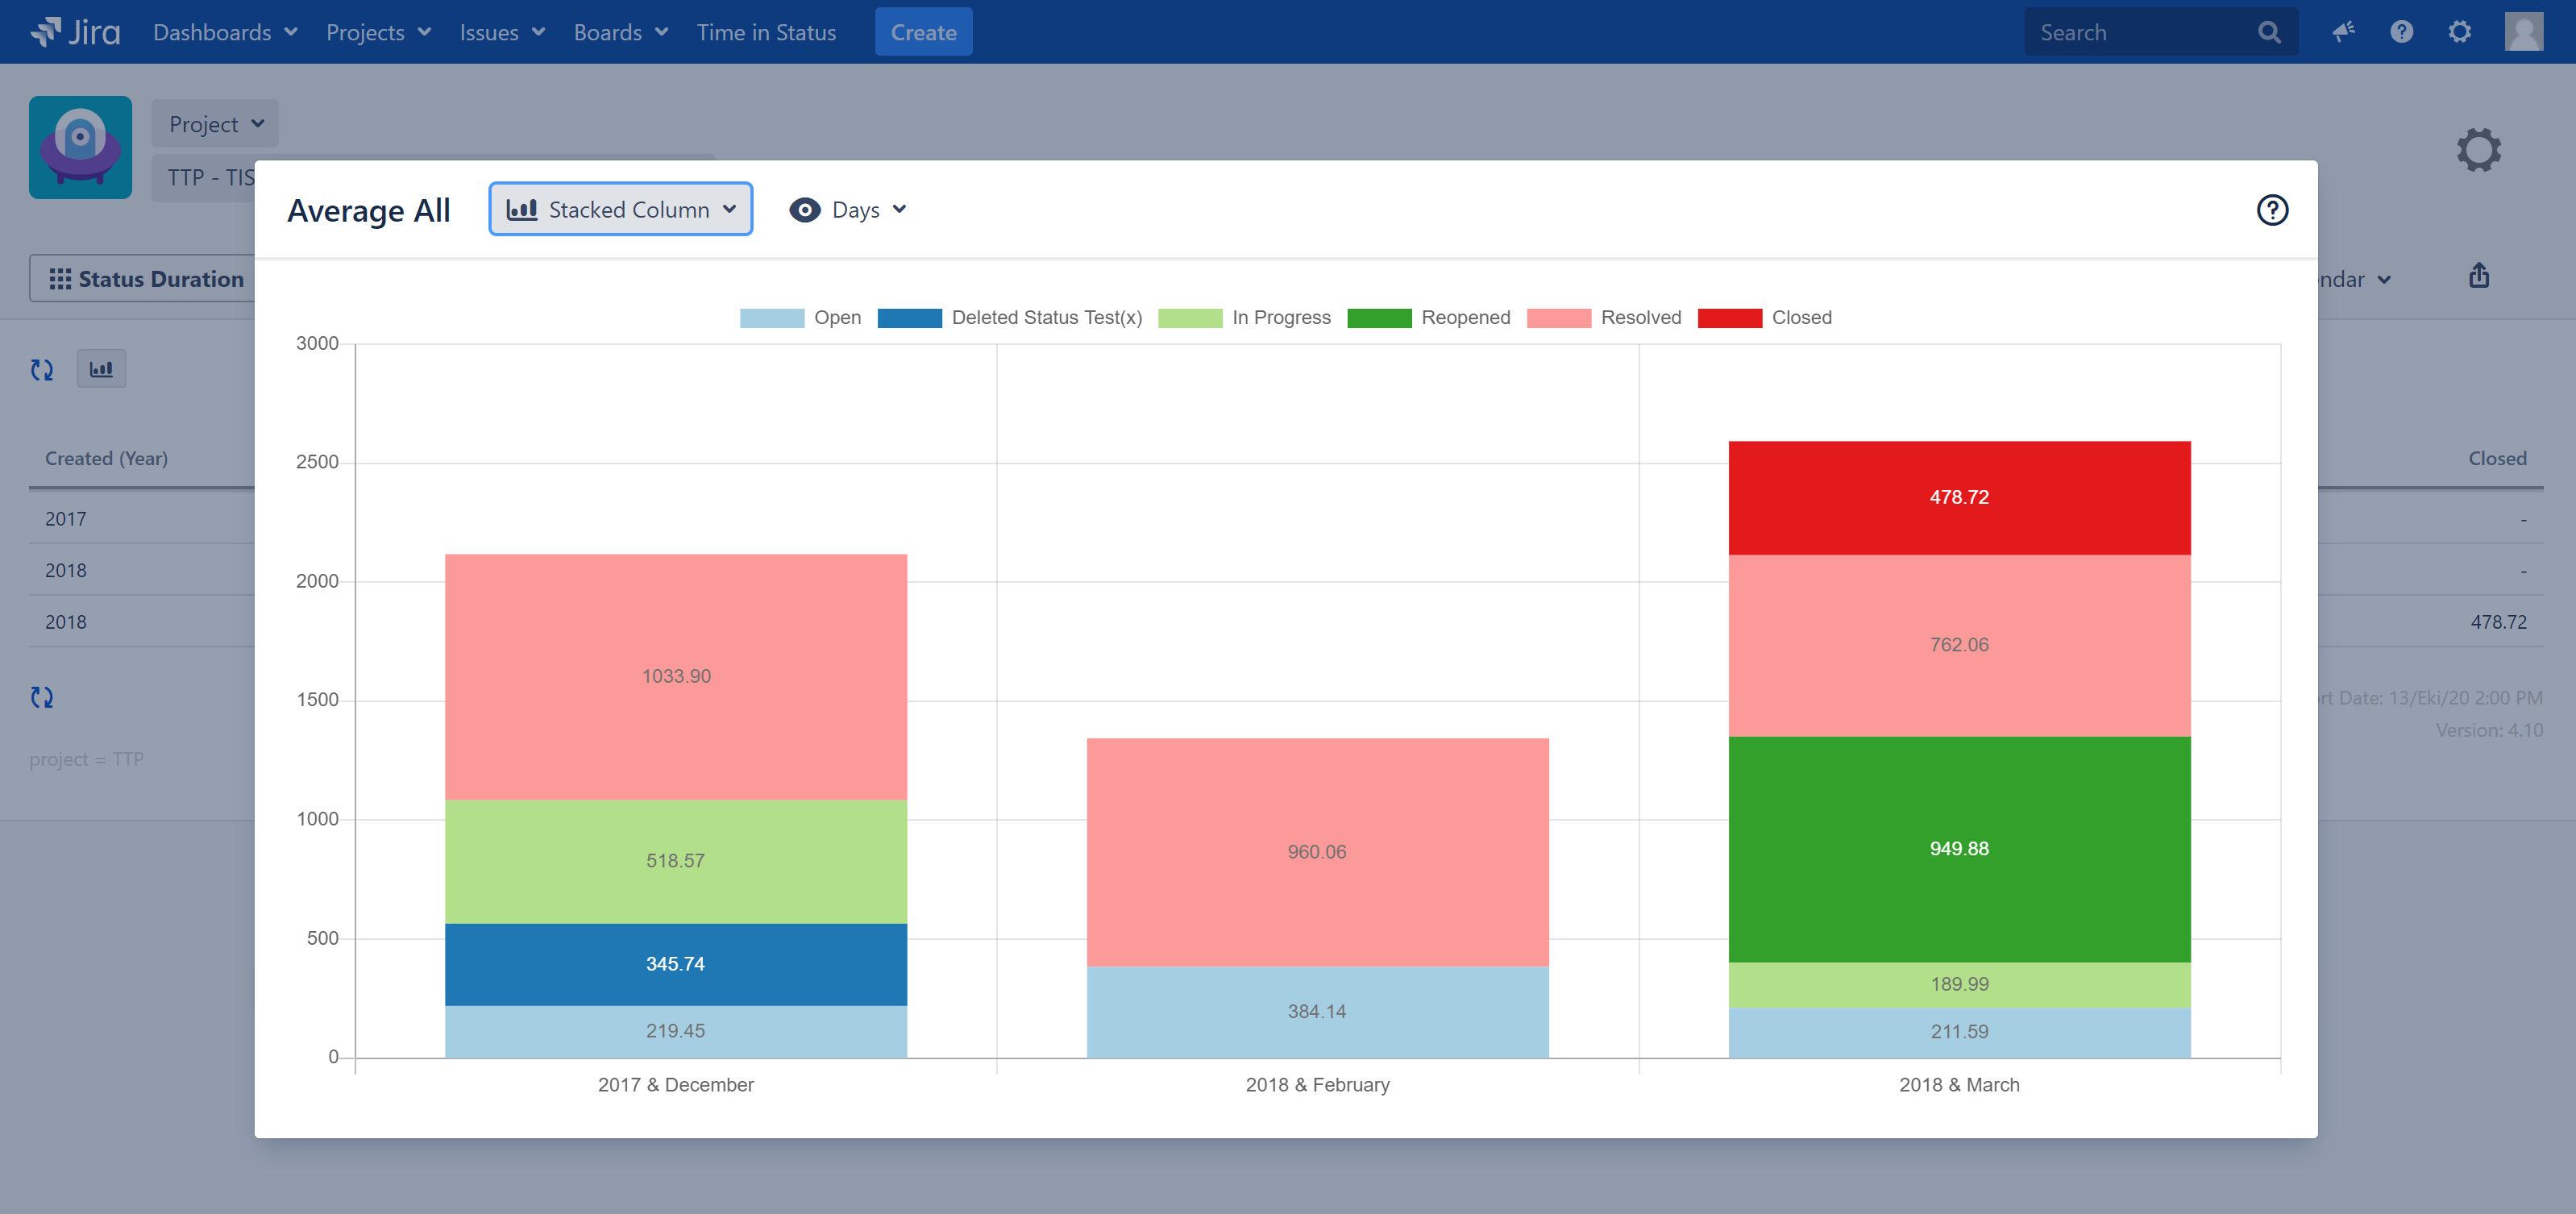
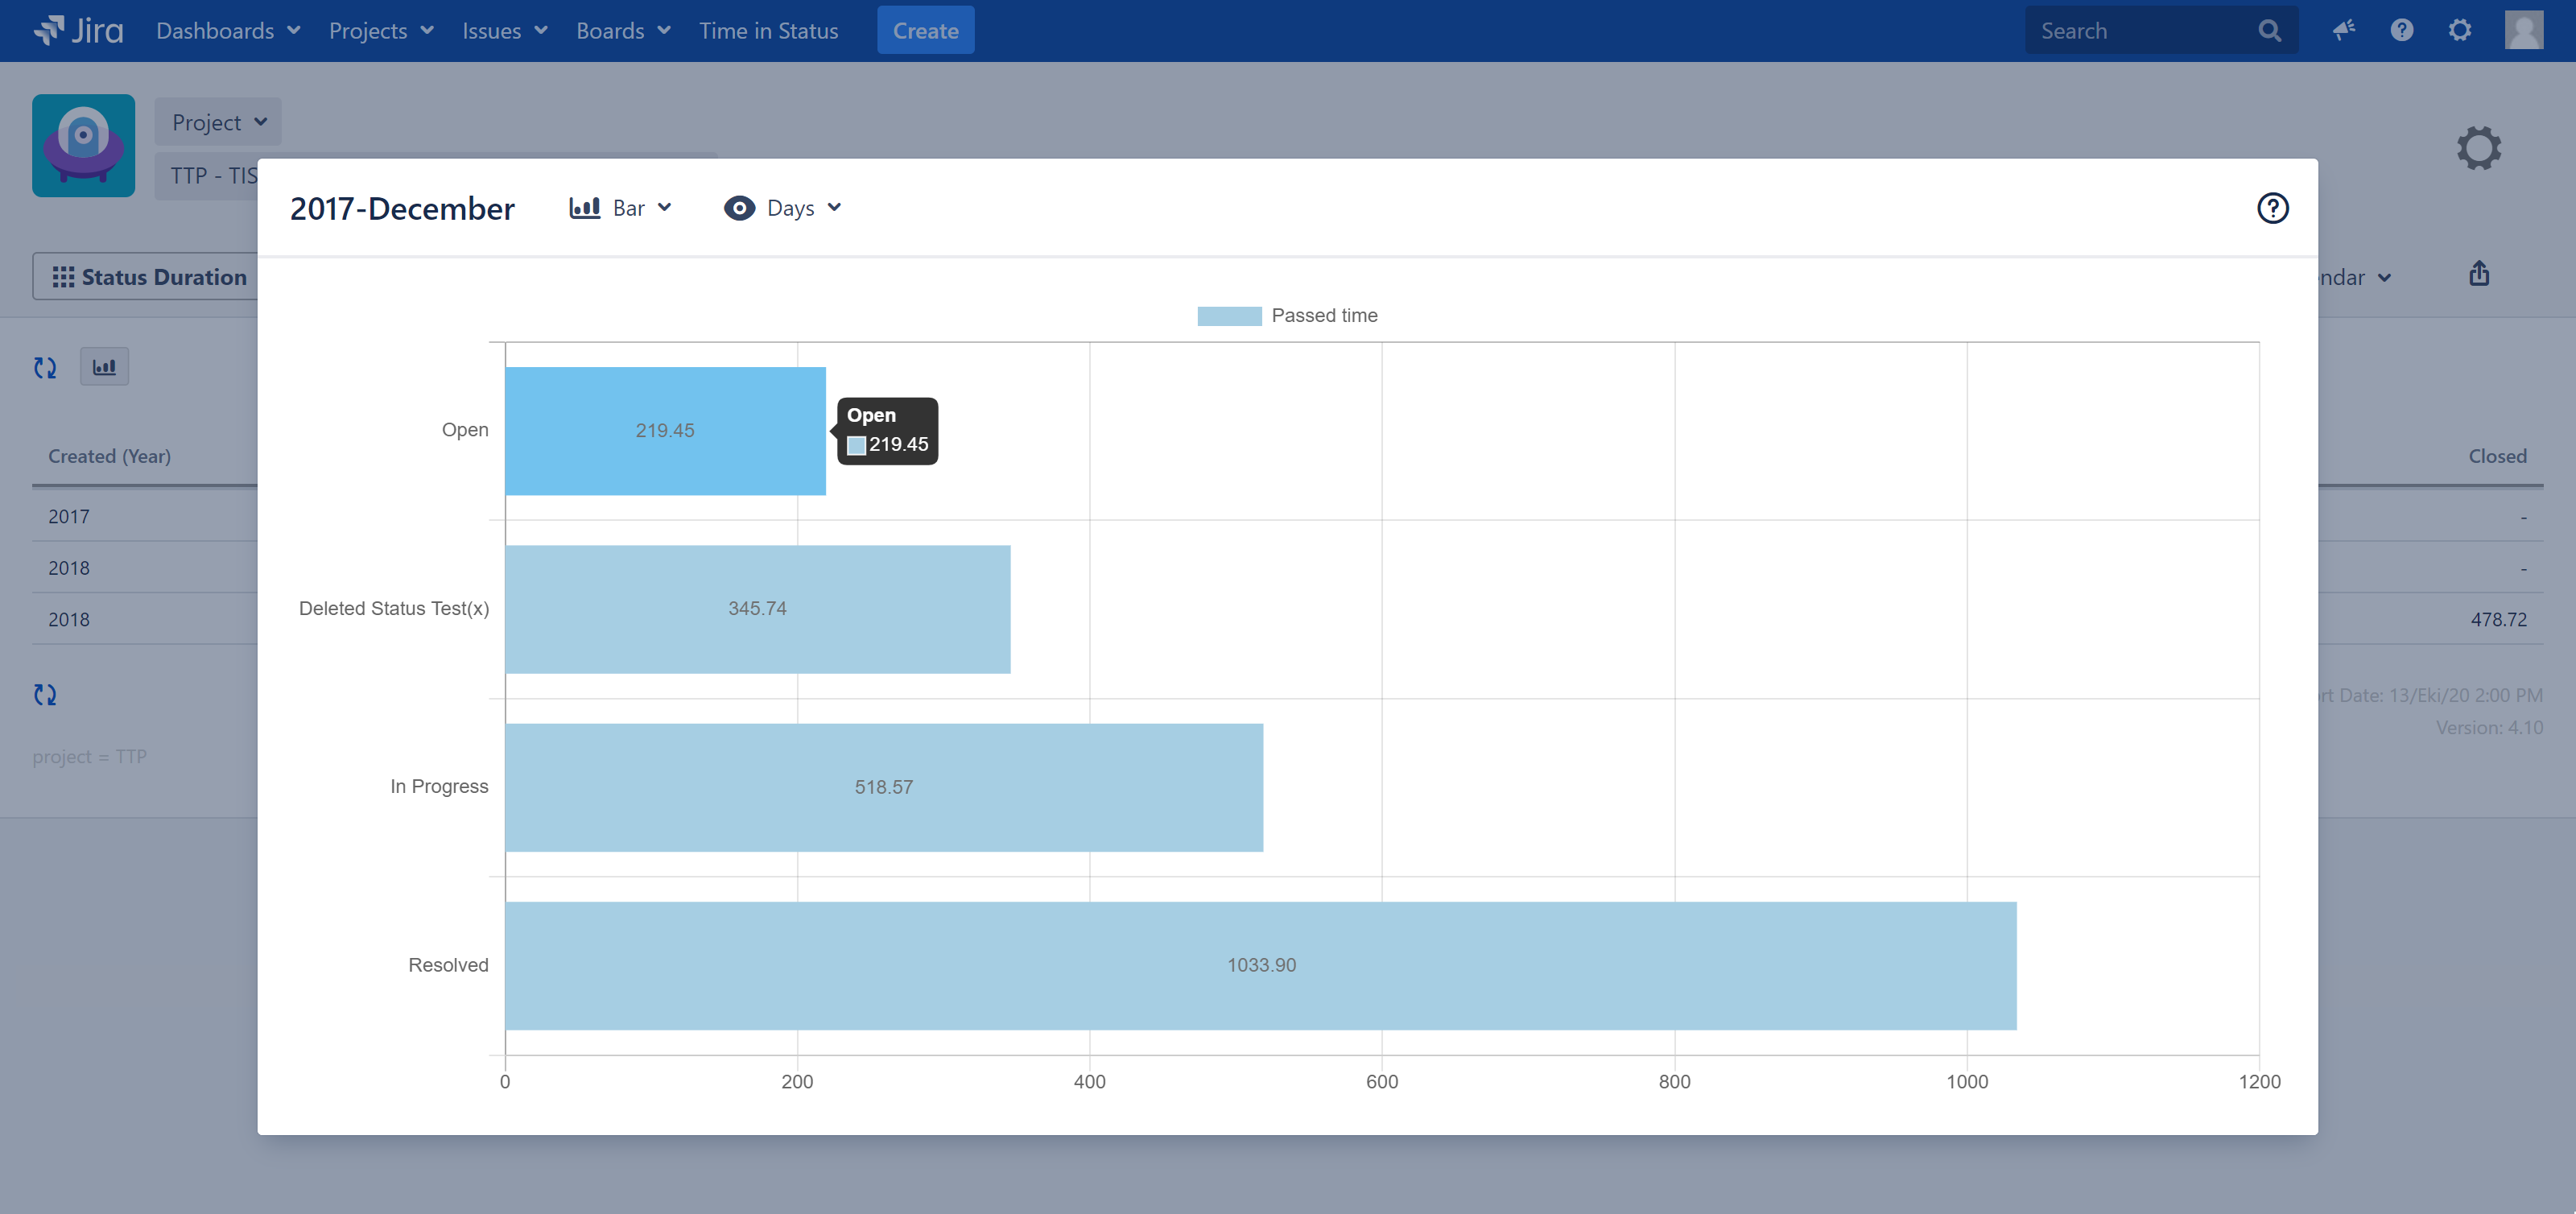
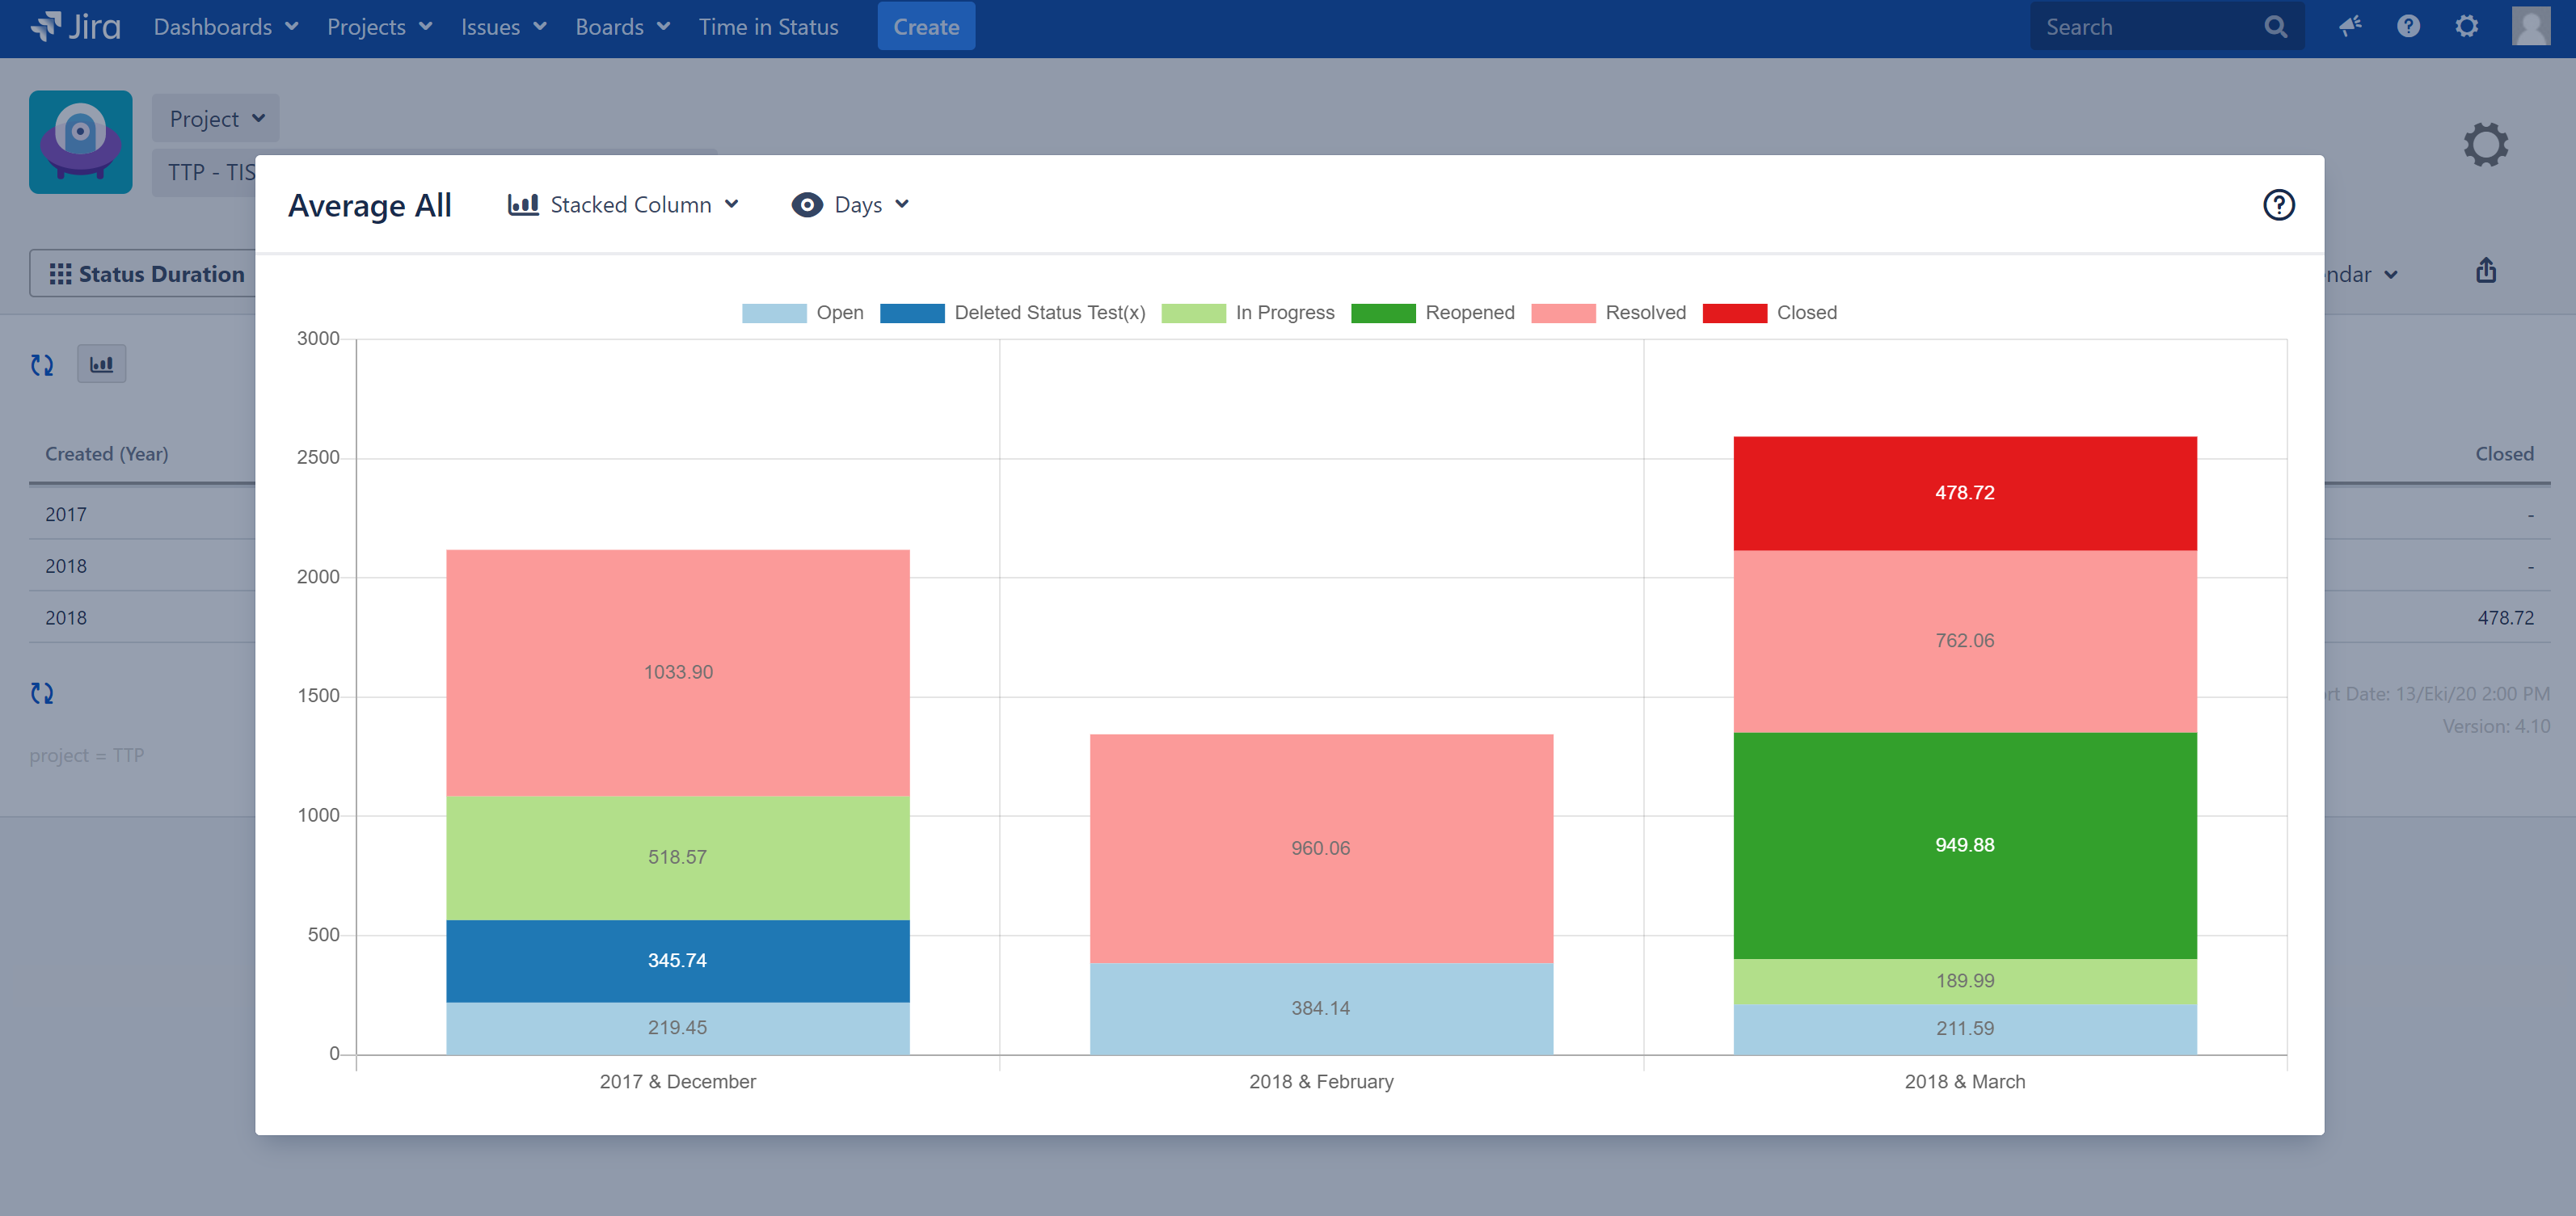
Time in Status report screen shows charts for individual report rows and an overall chart for aggreagated reports.
Look for this button on the page to see where charts are available: 
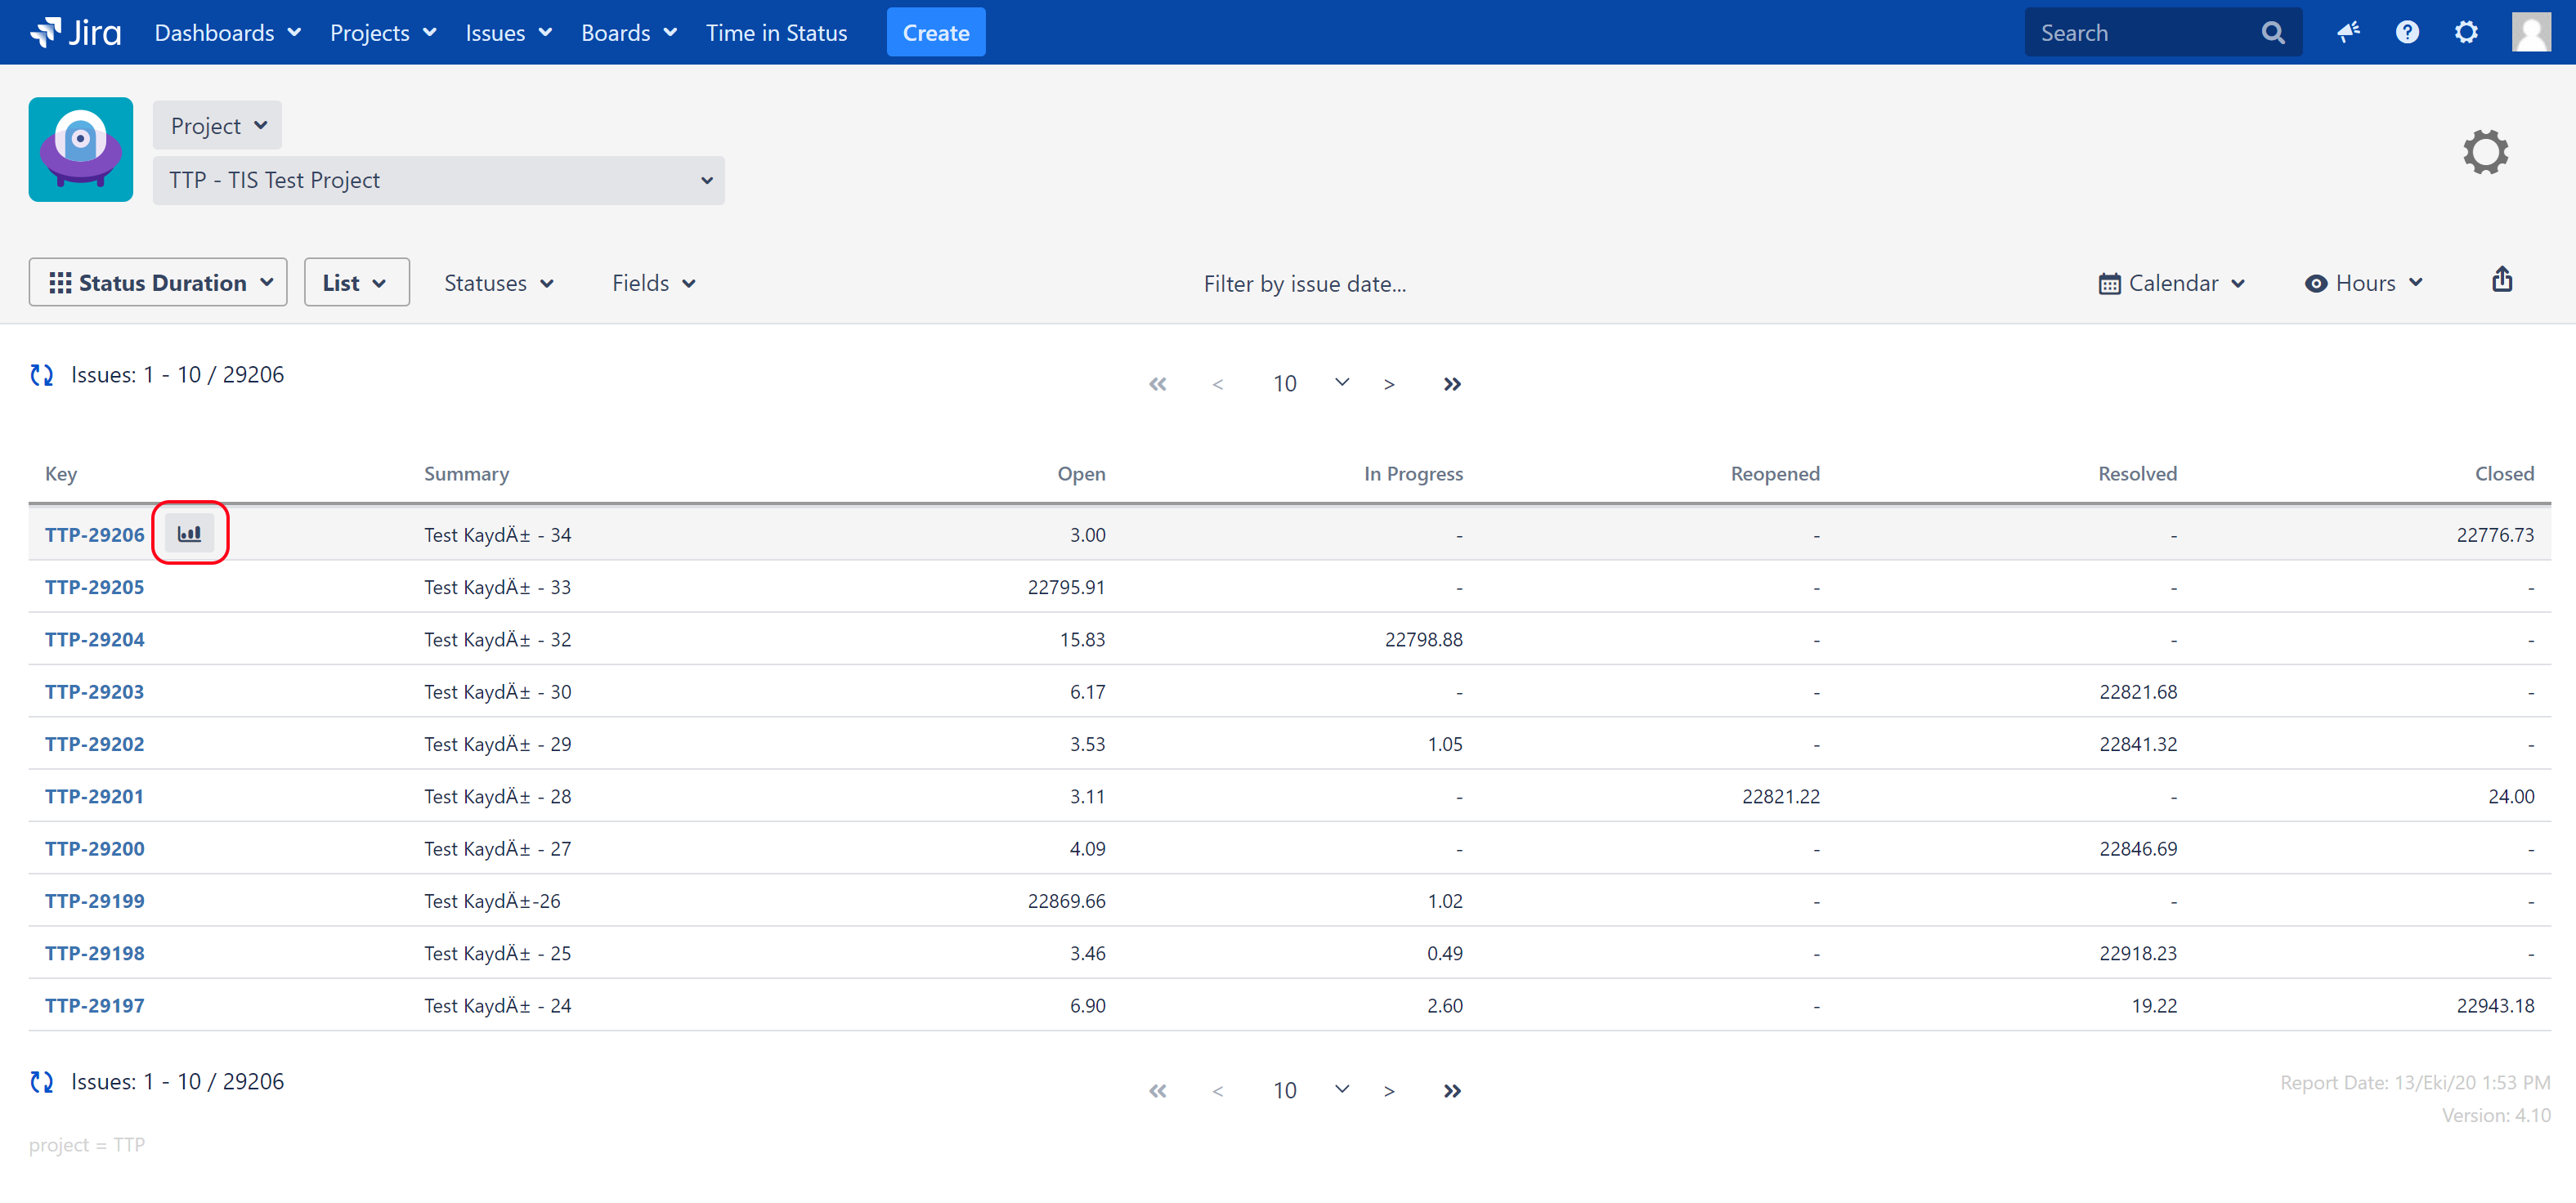
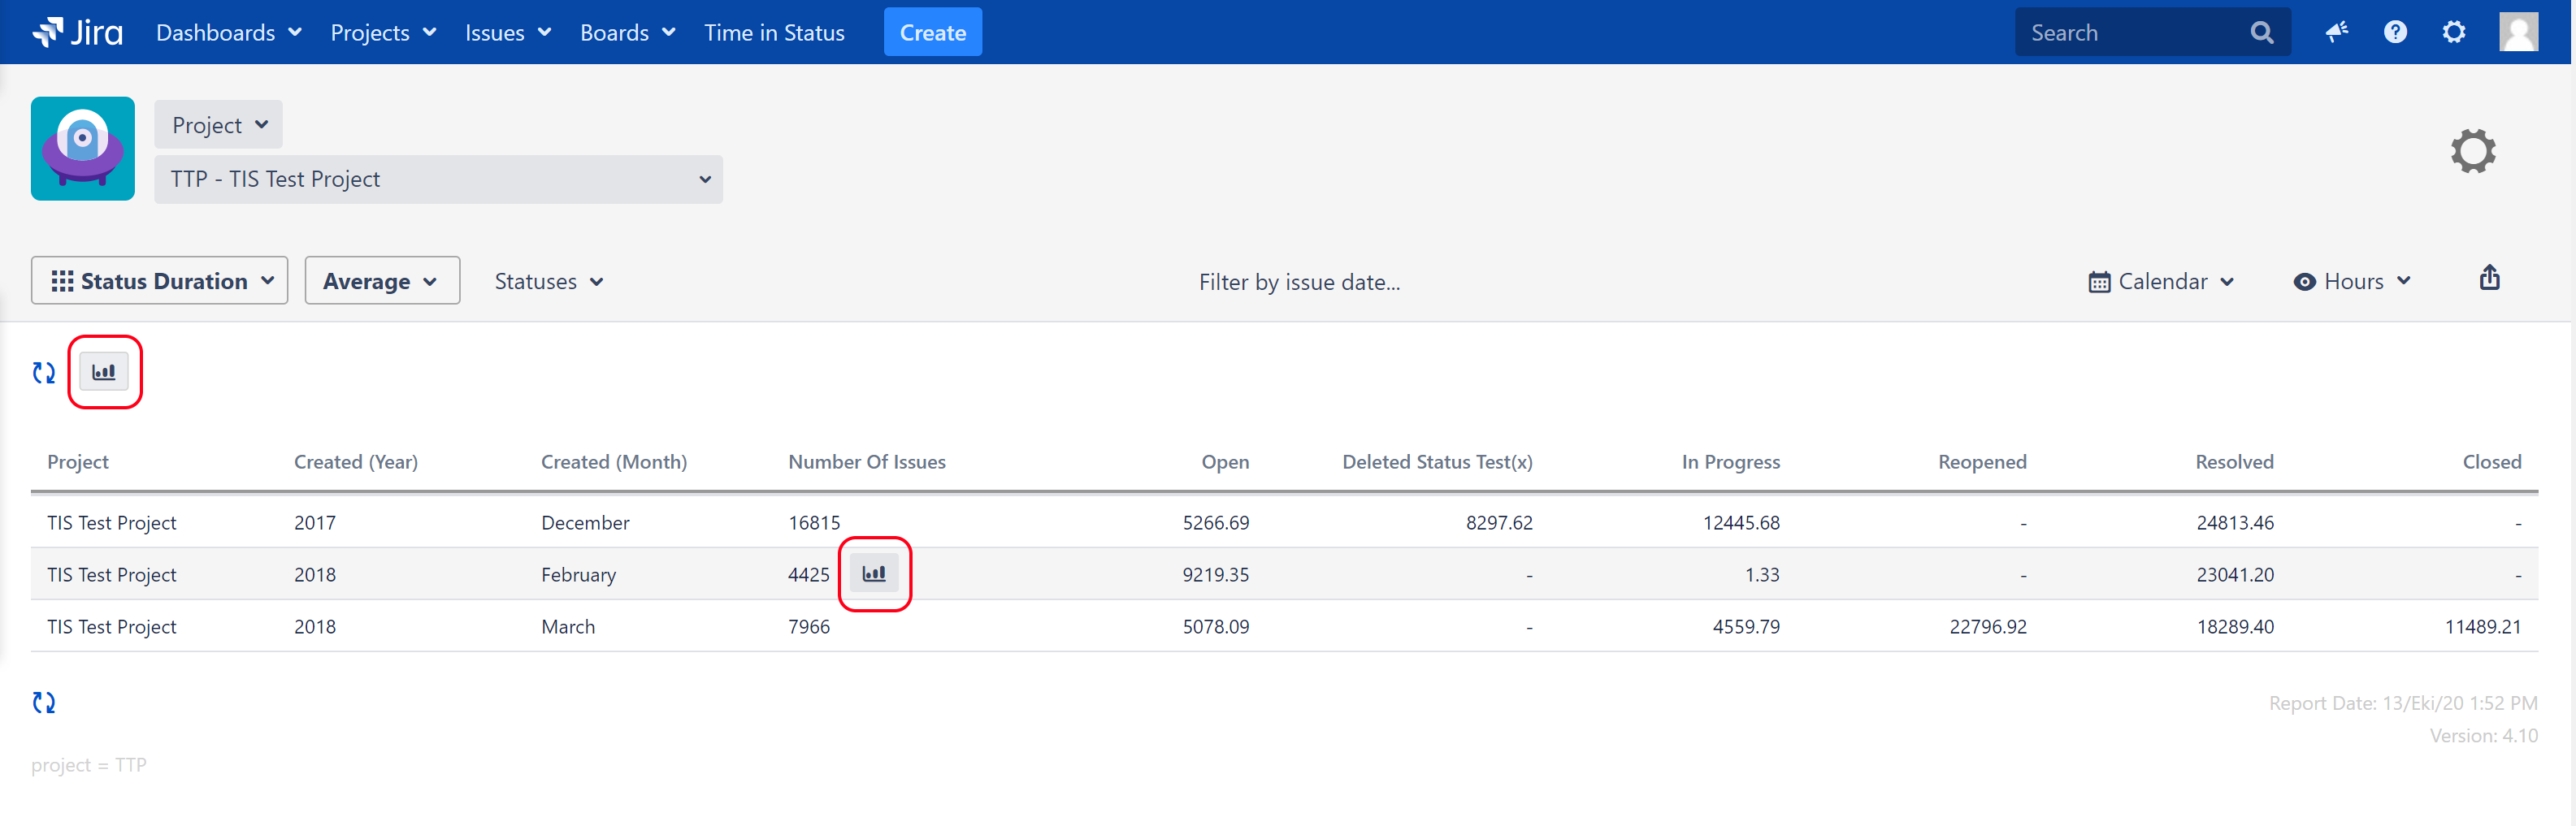
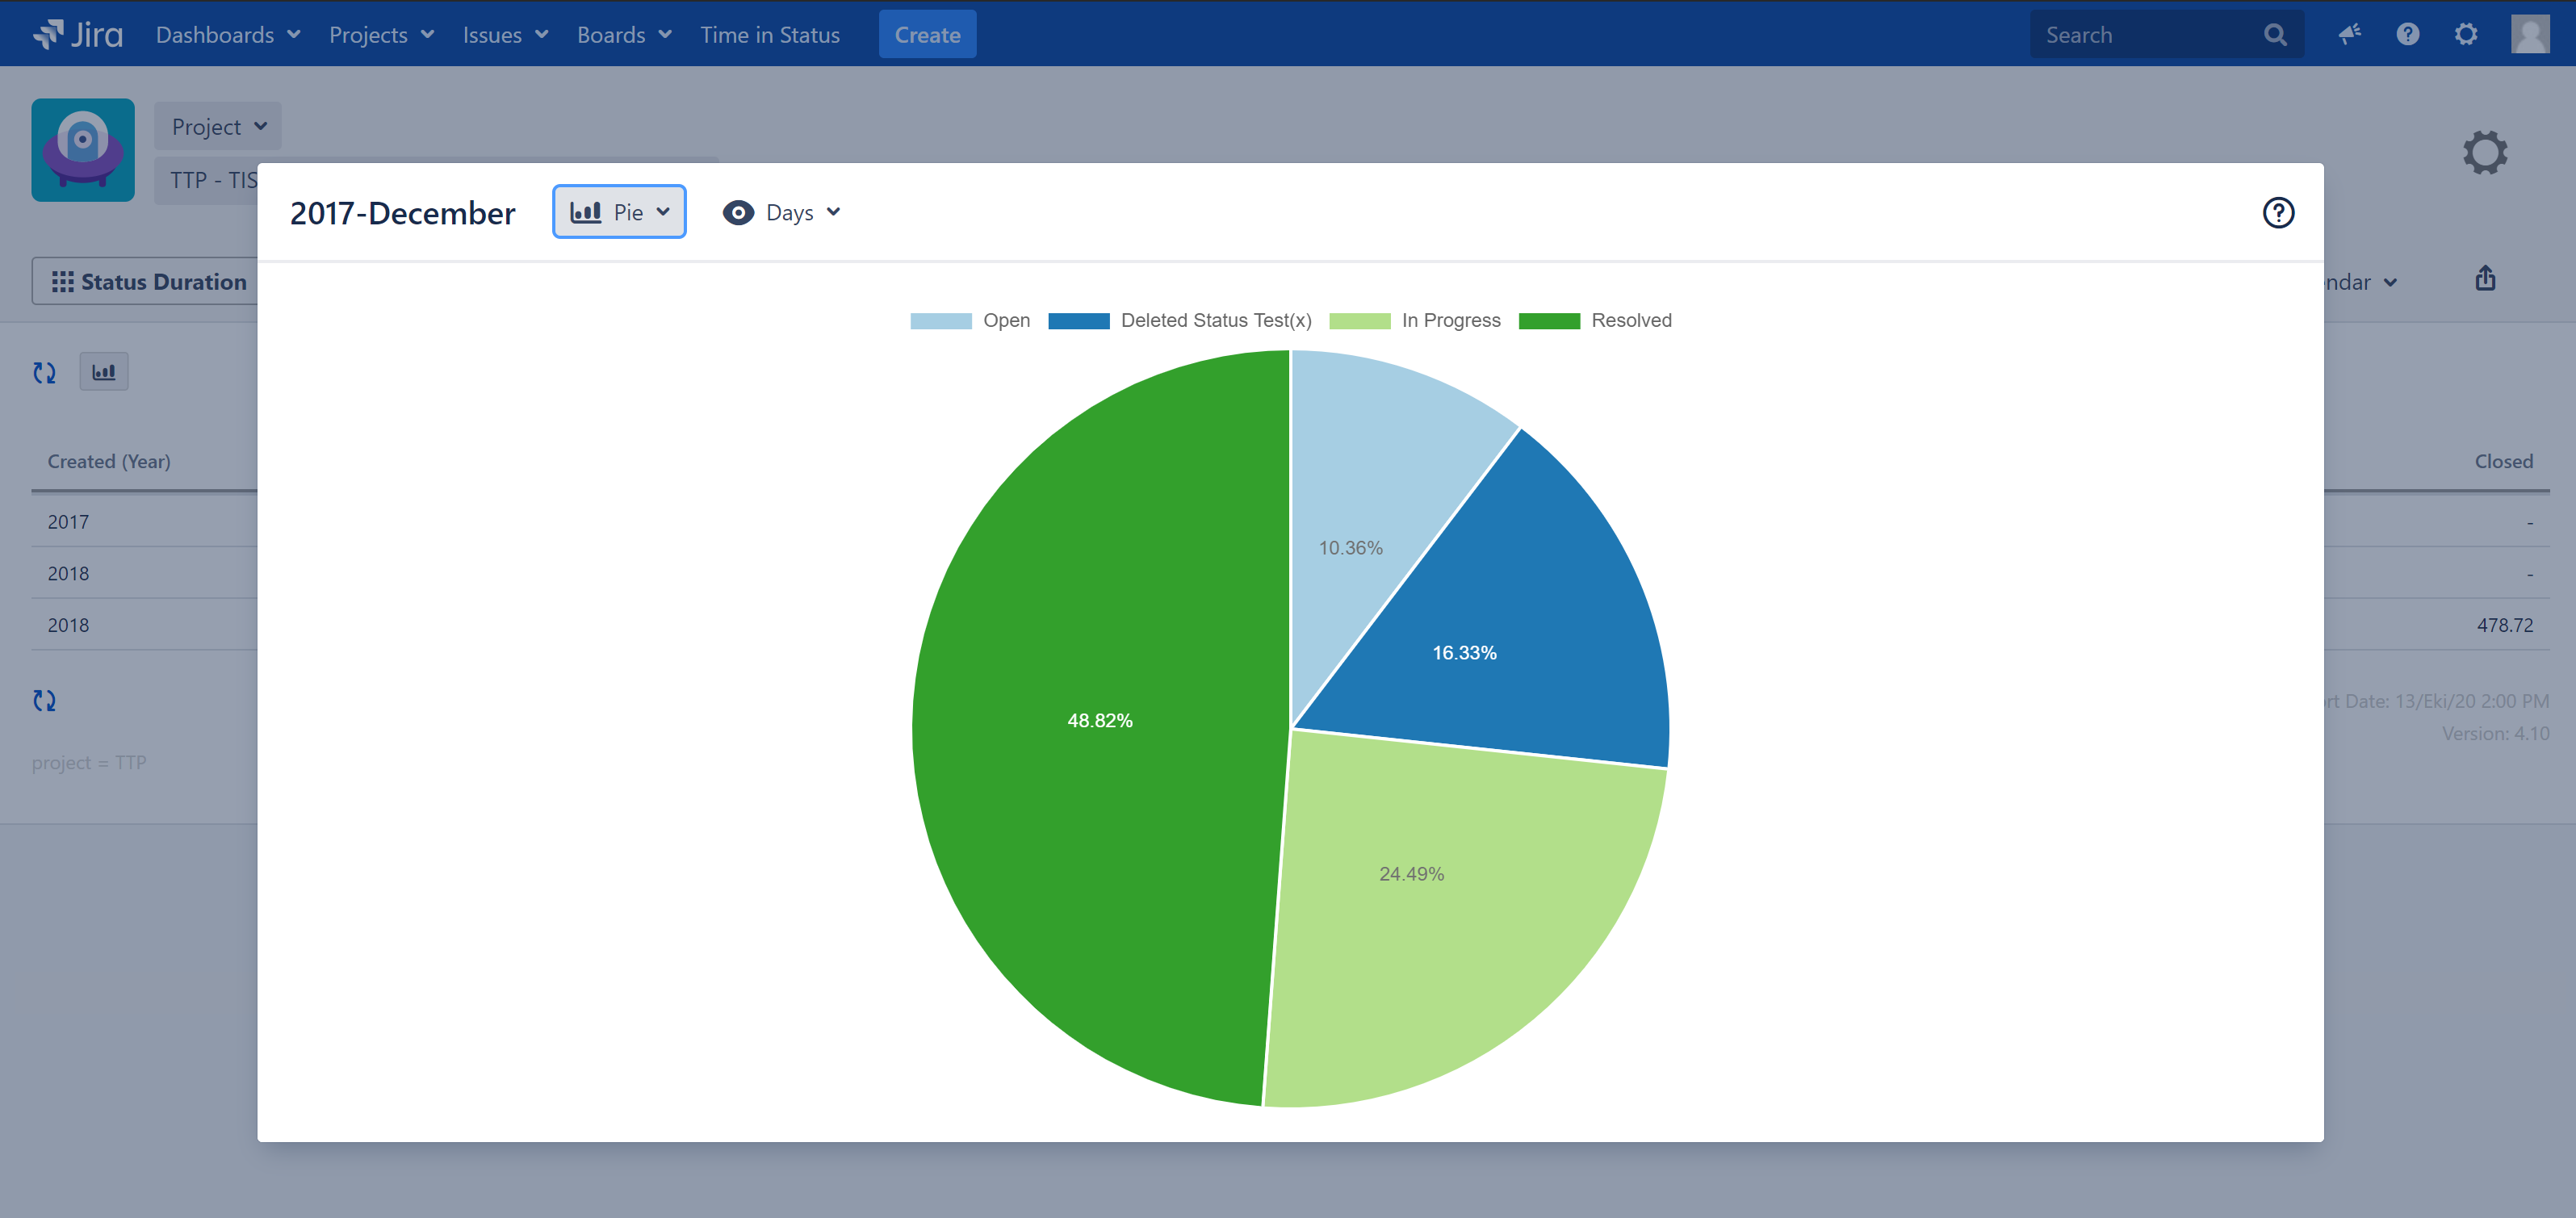
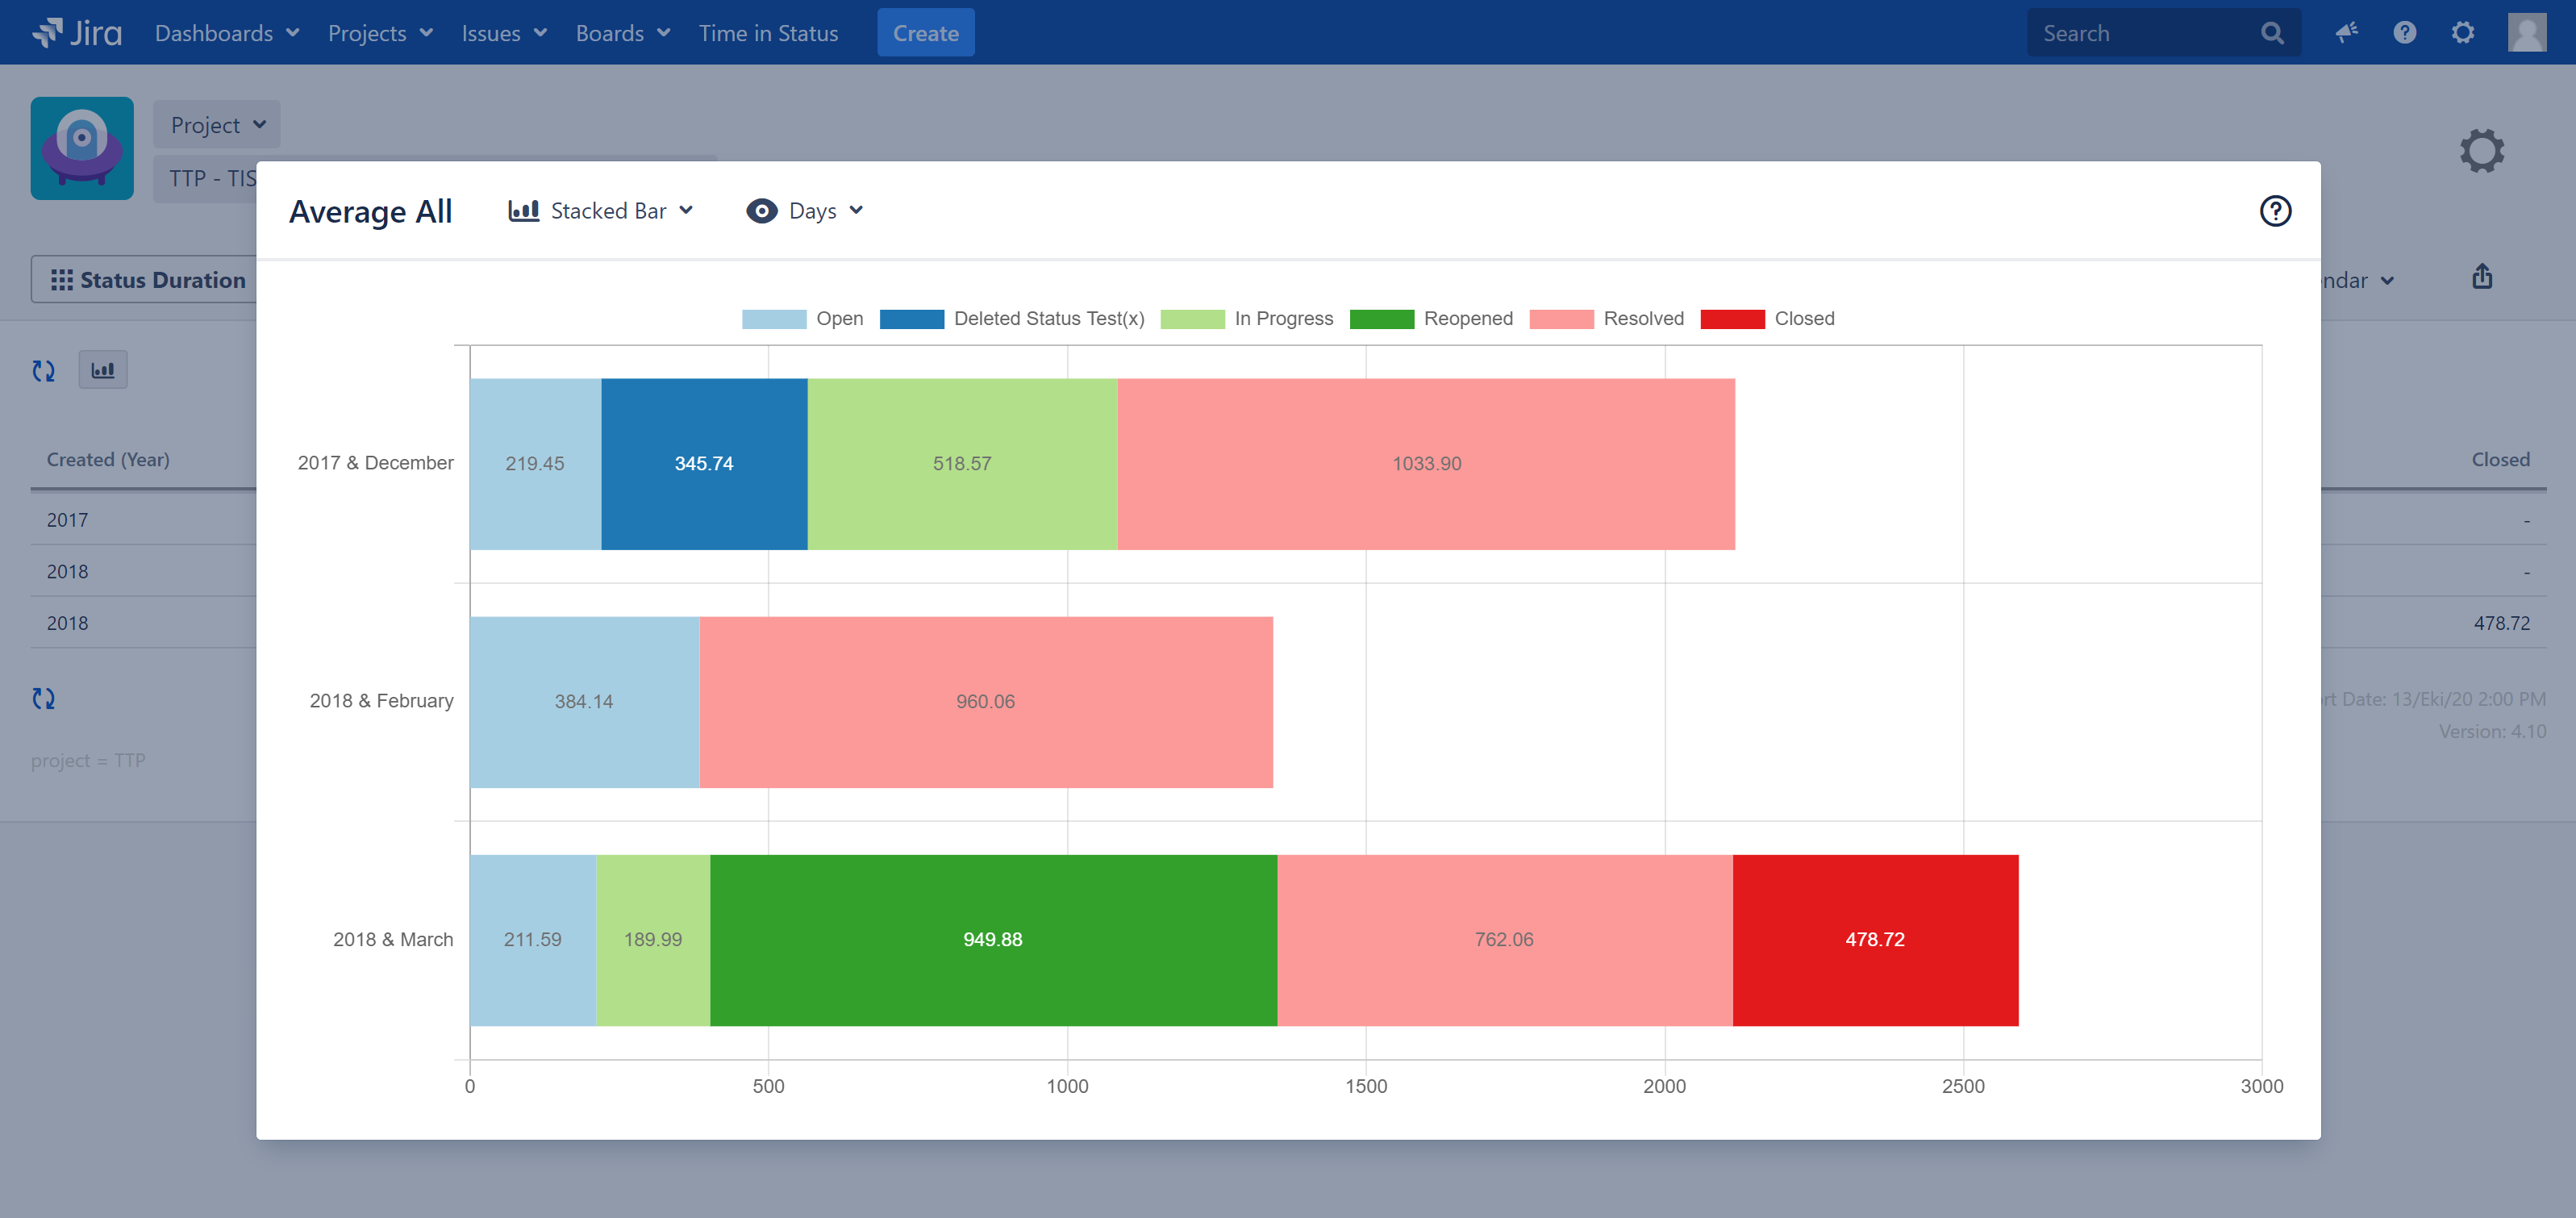
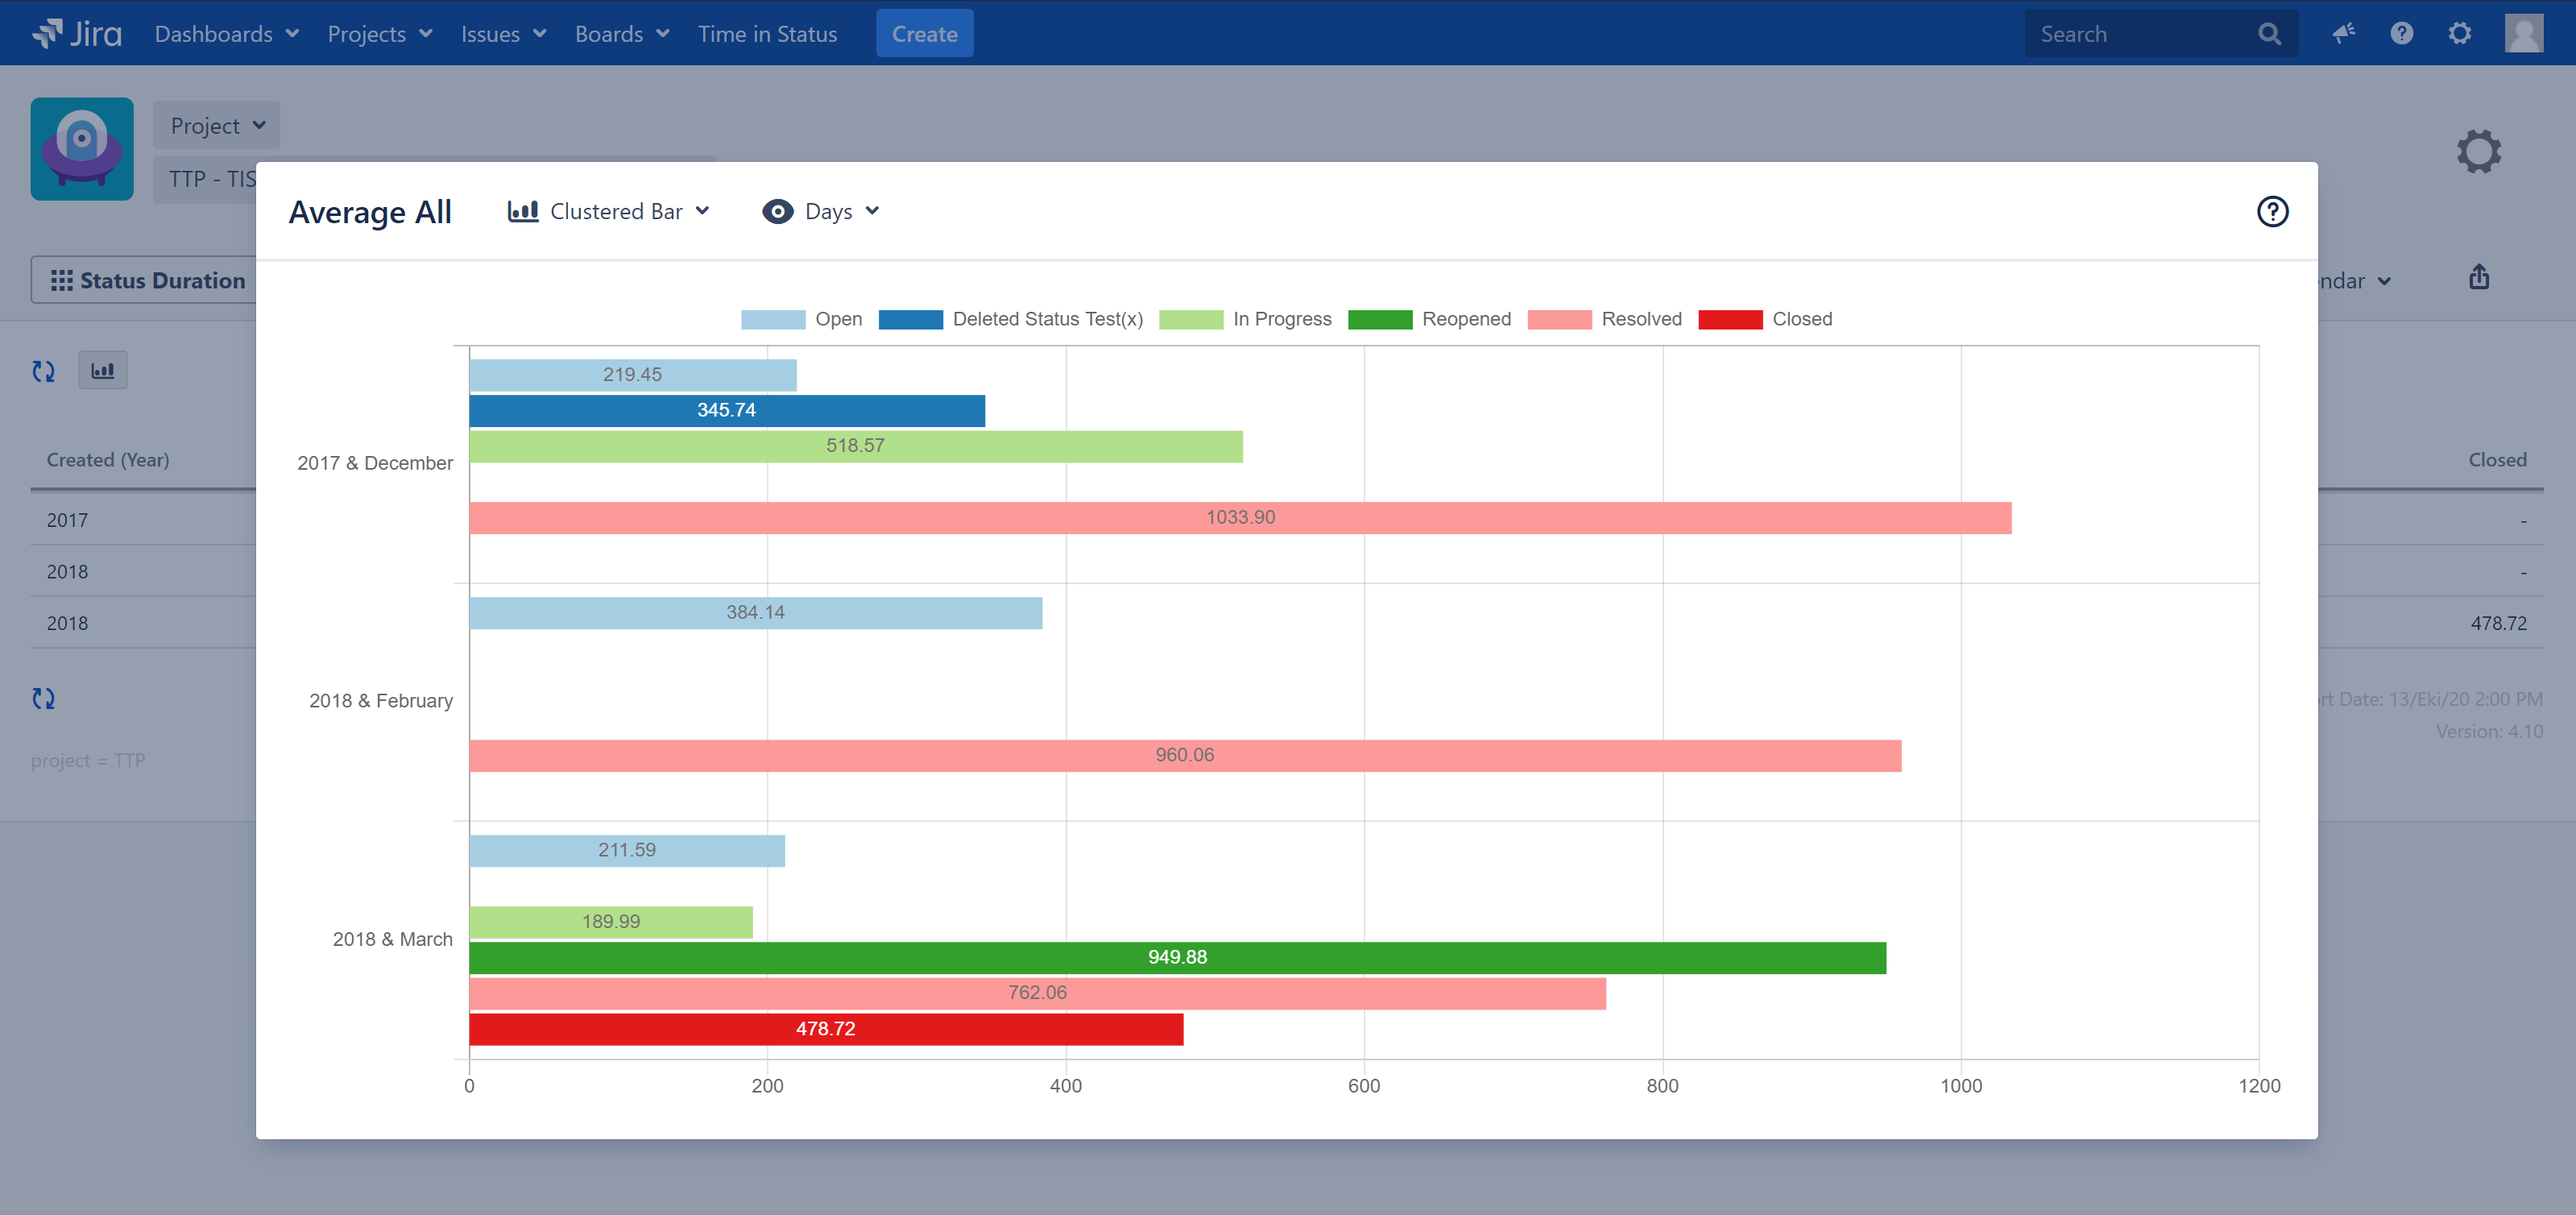
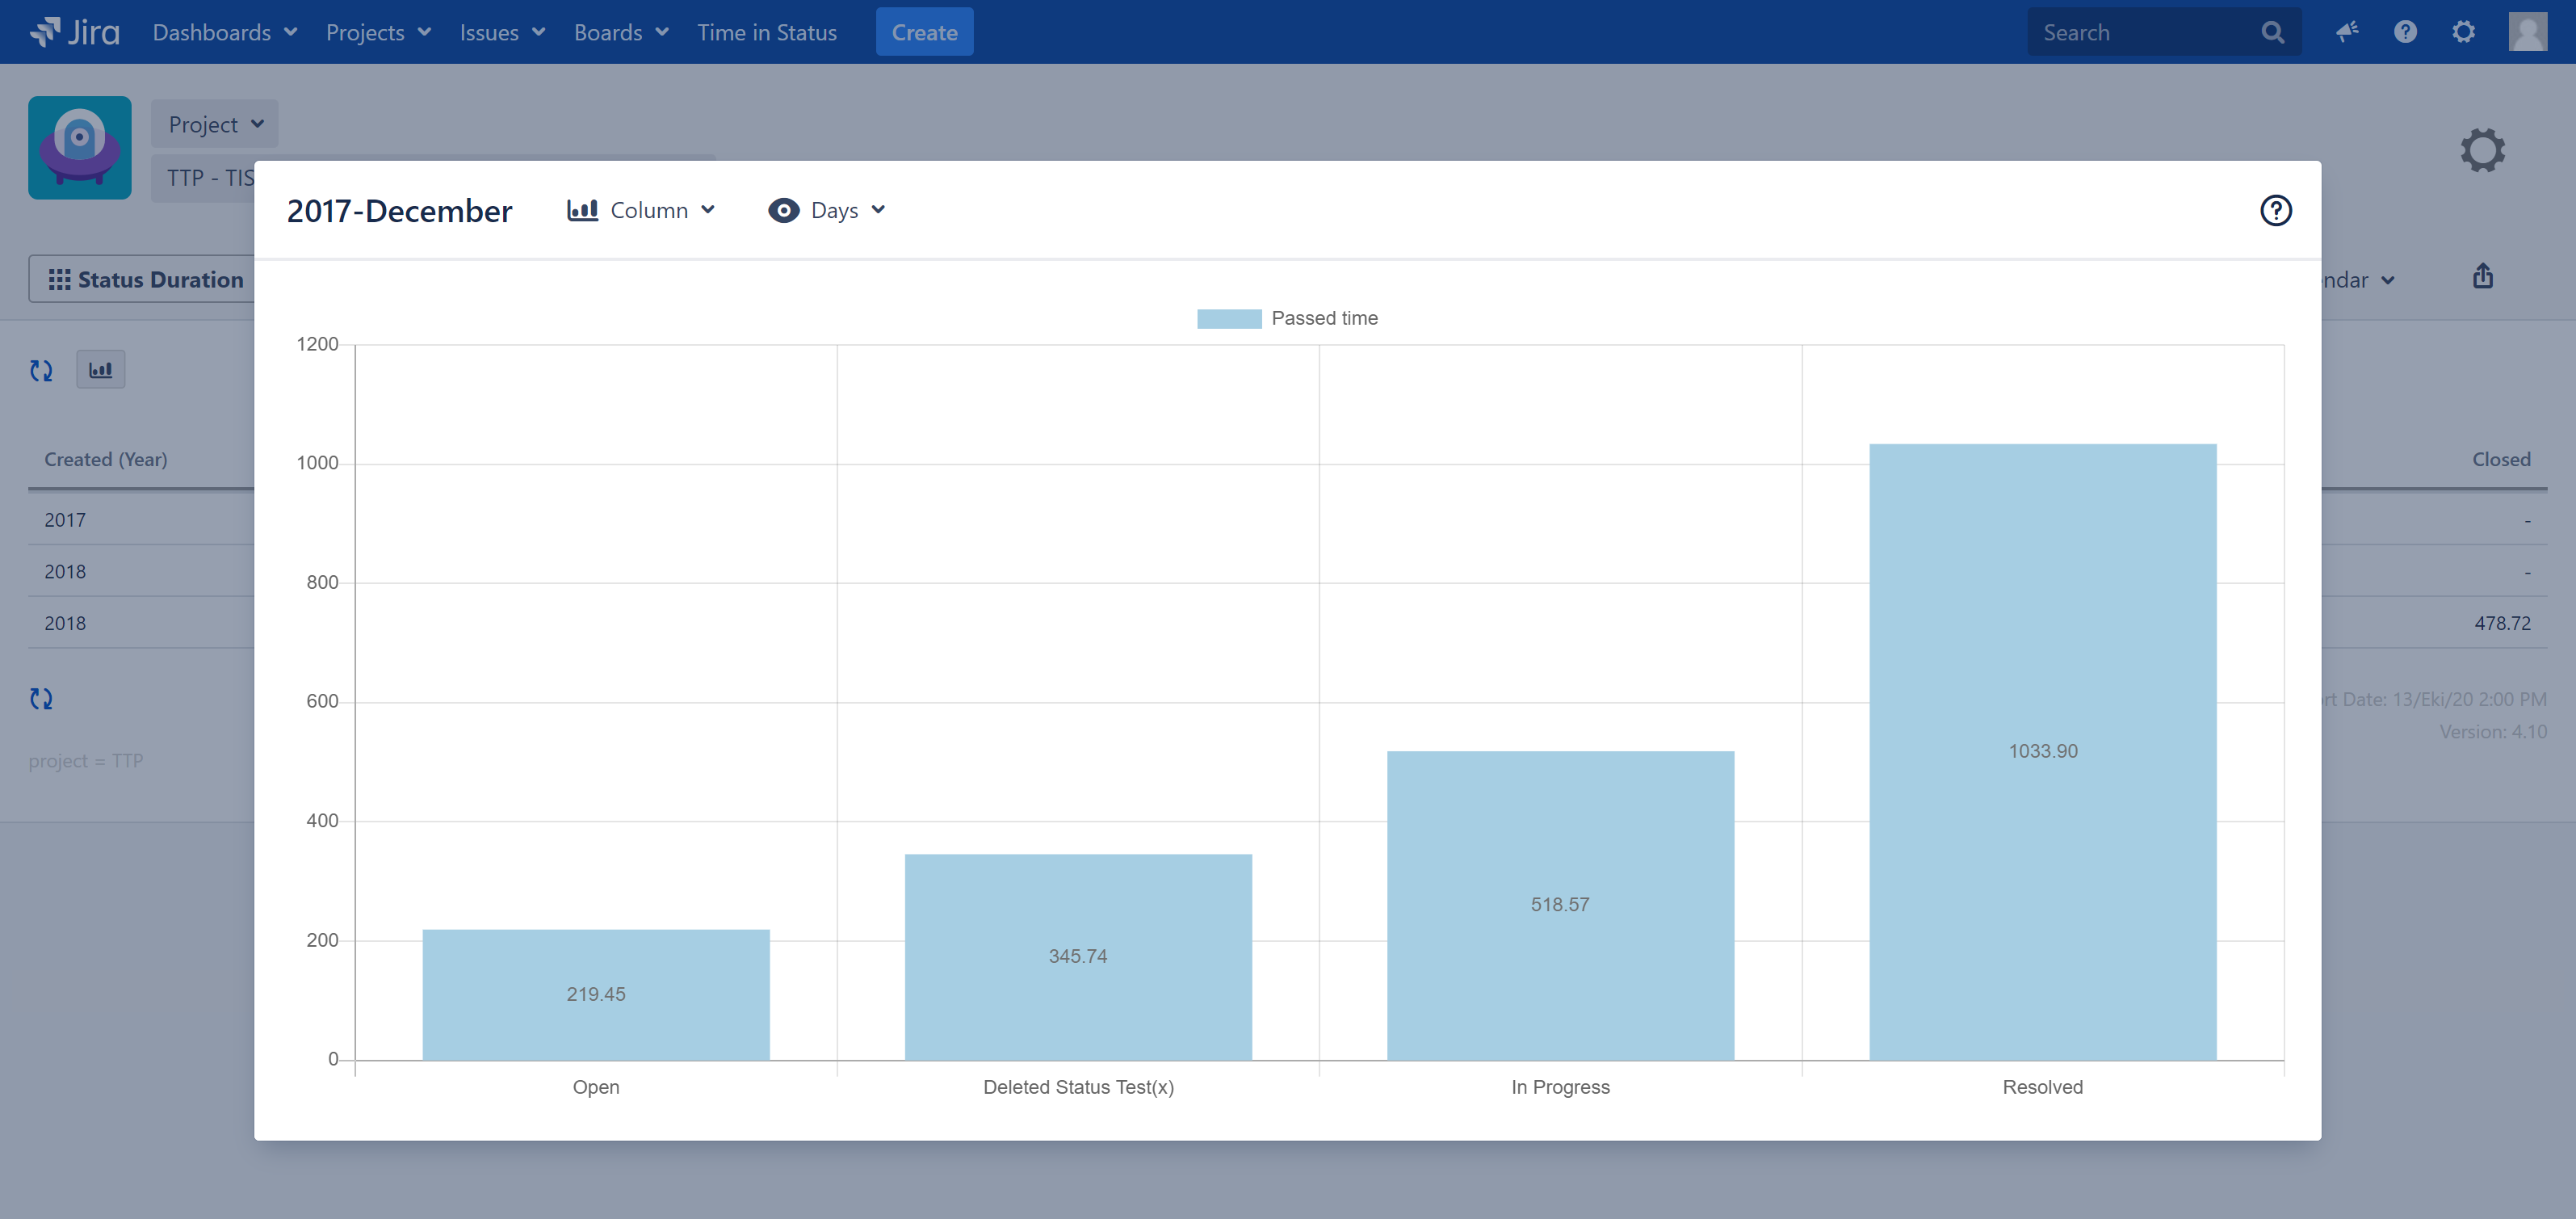
Chart Types
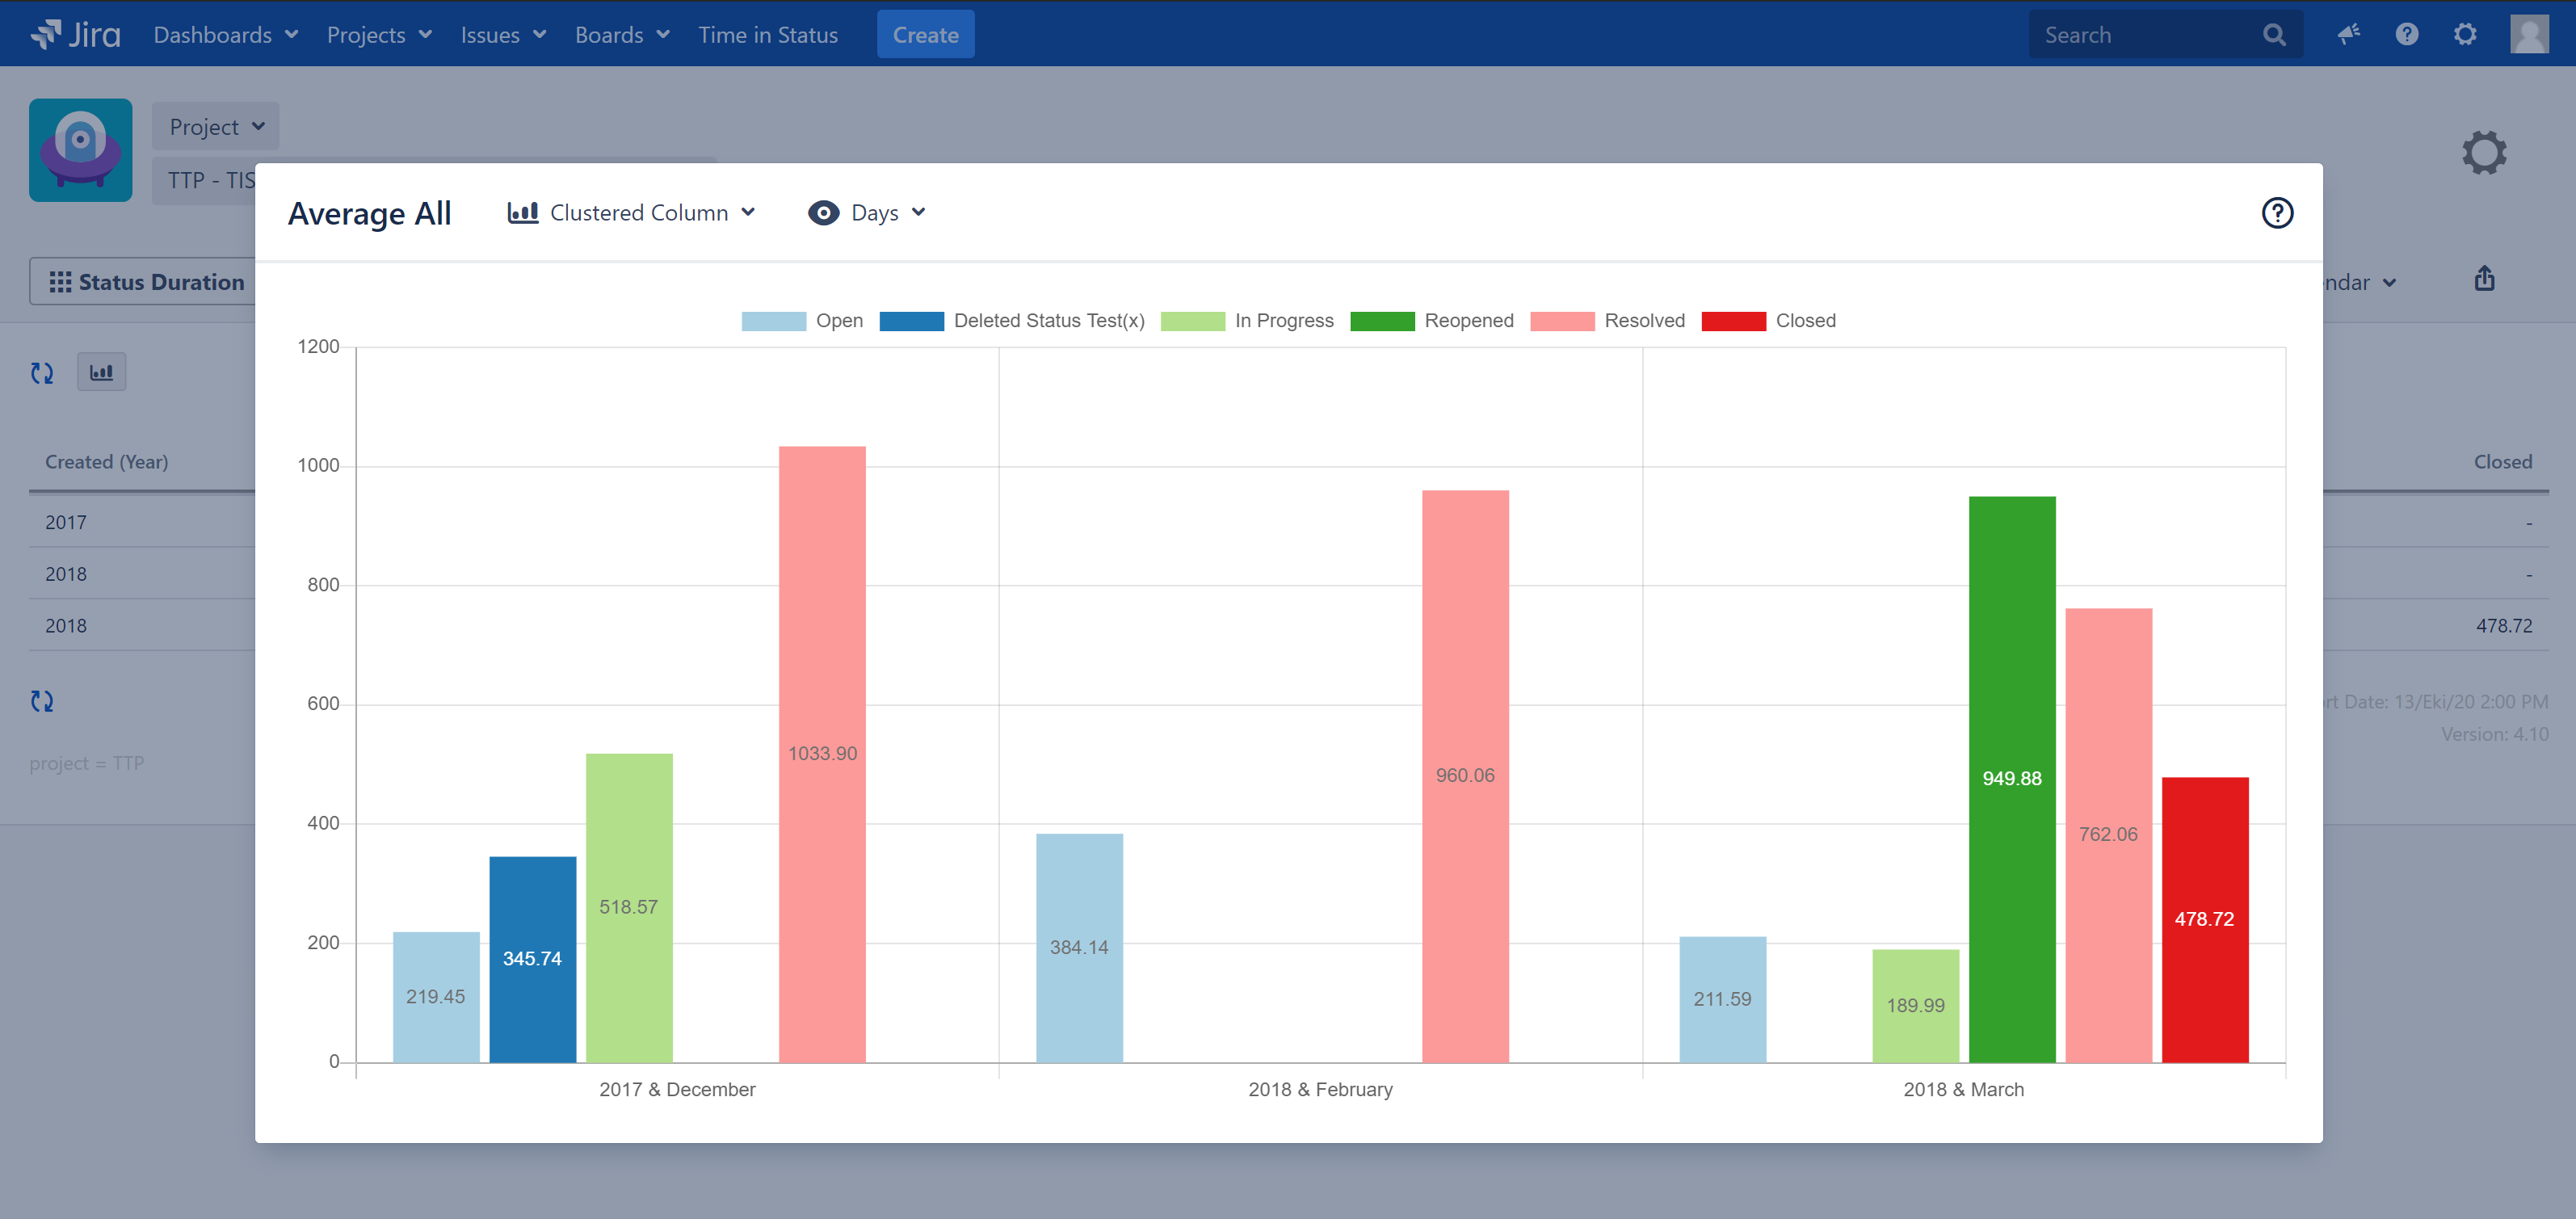
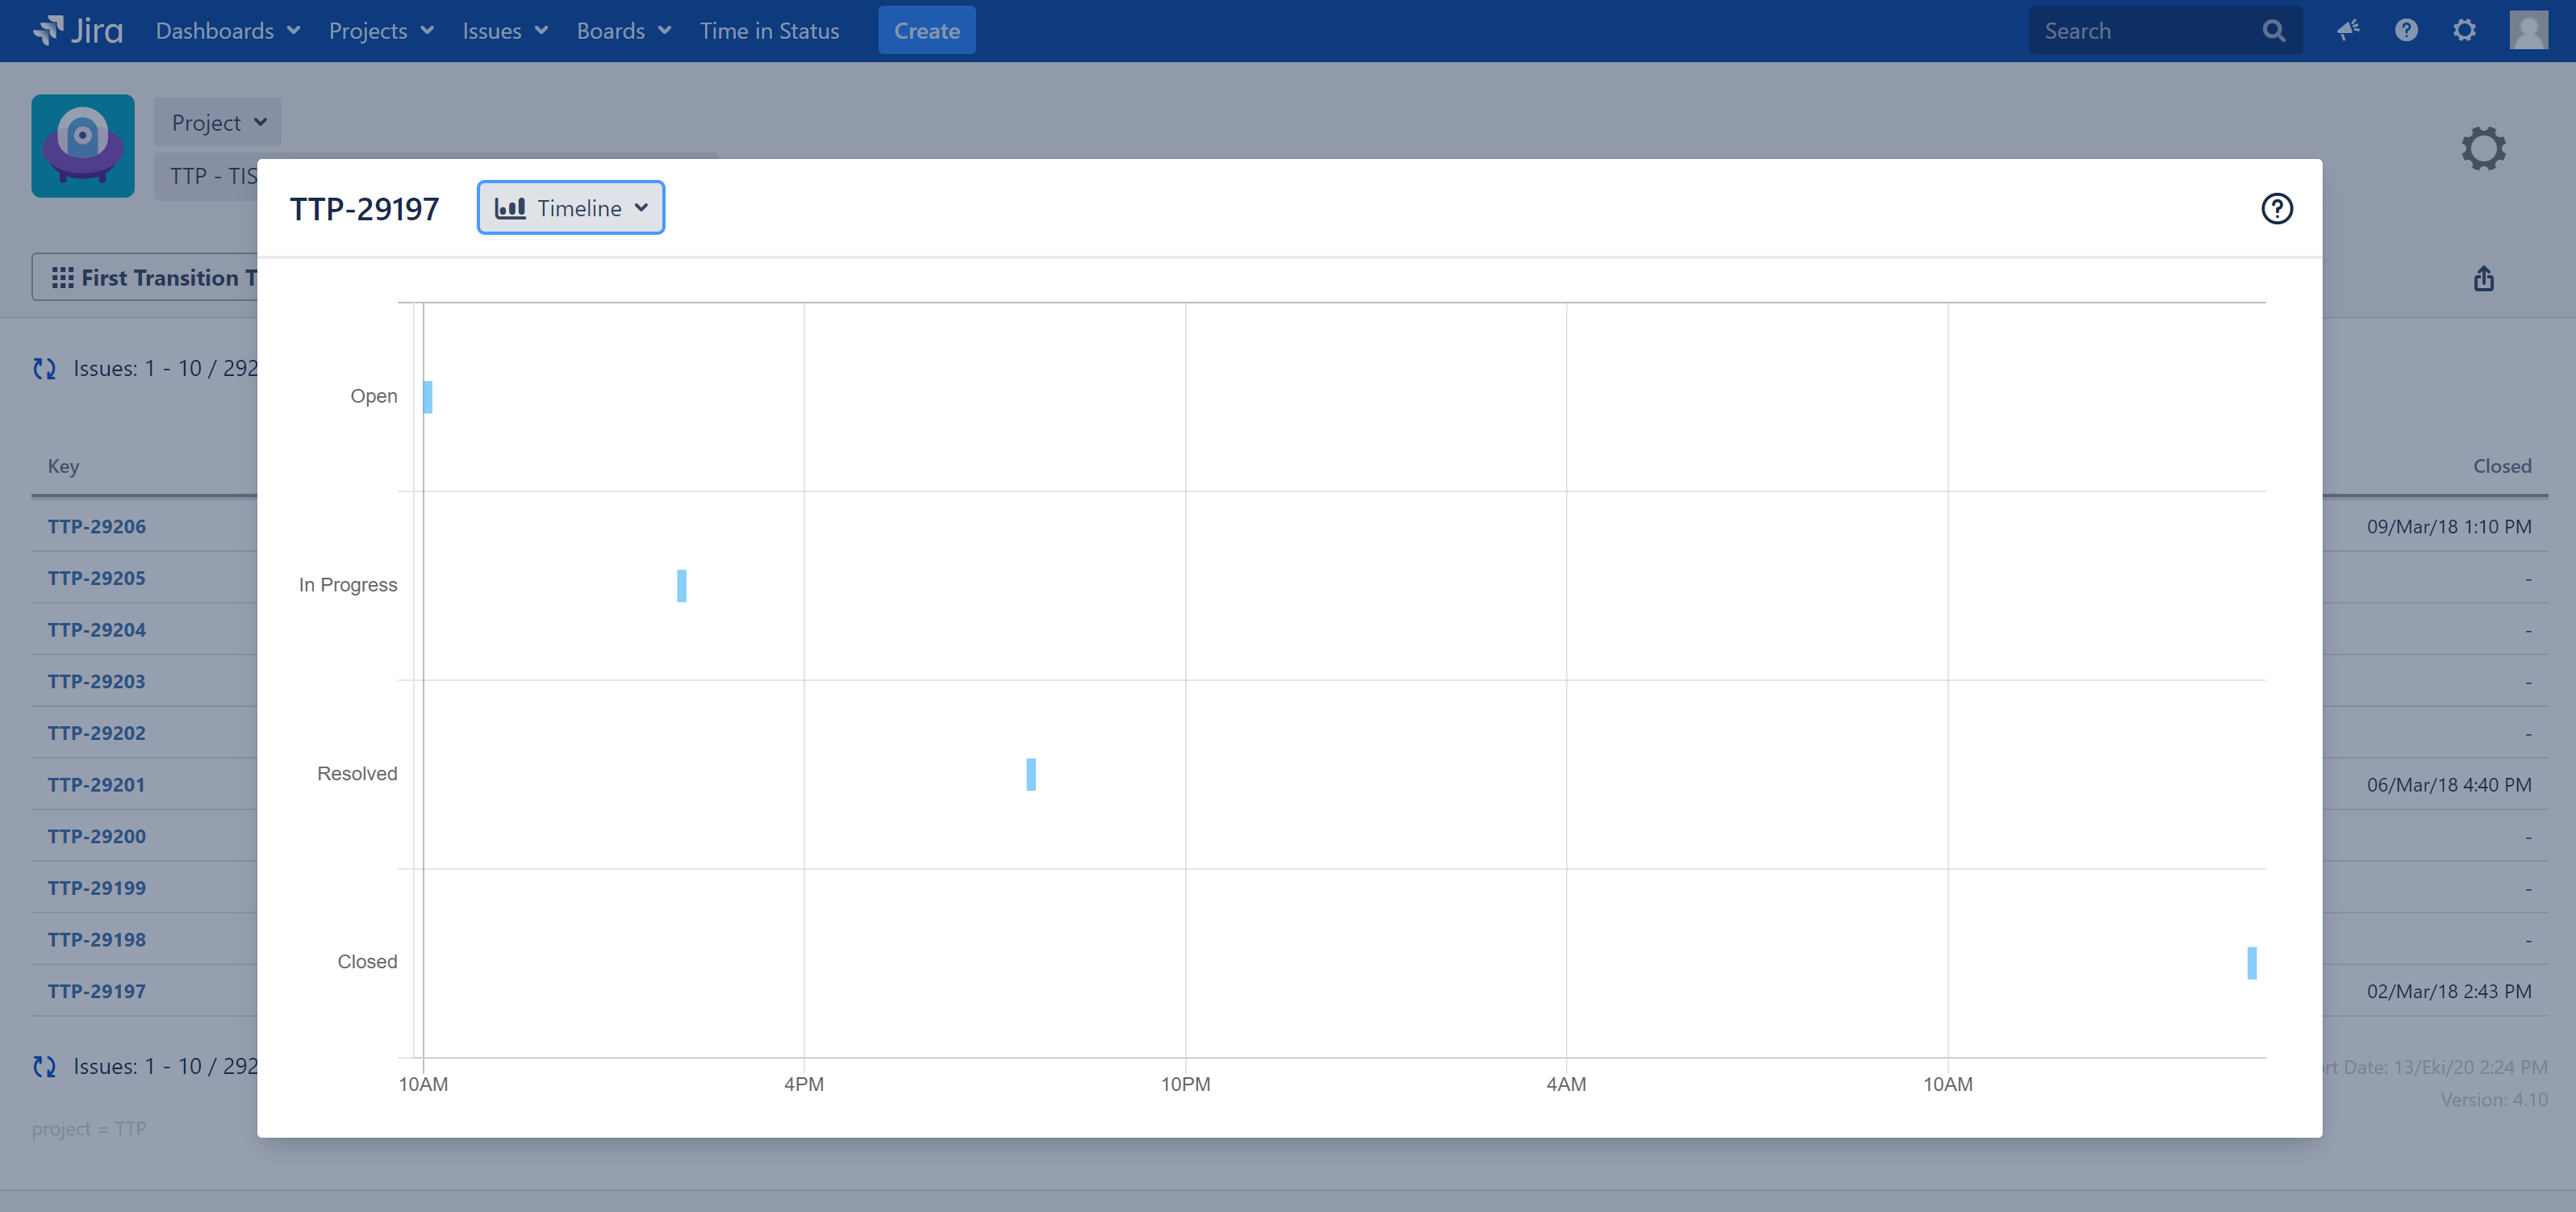
There are several chart types available that are selectible using the chart-type button on the top-left corner of the dialog.
Exclude Current State
If you are looking at an issue that hasn't been updated for a long time (for example the issue was closed months ago), the charts will be completely dominated by the latest state of the issue and earlier statuses/assignees will not be distinguishable in the chart.
To overcome this you can use the Exclude Current State checkbox. When checked, this option causes the status/assignee duration since the last change in issue history to be excluded from the report. This way charts display much more useful output.
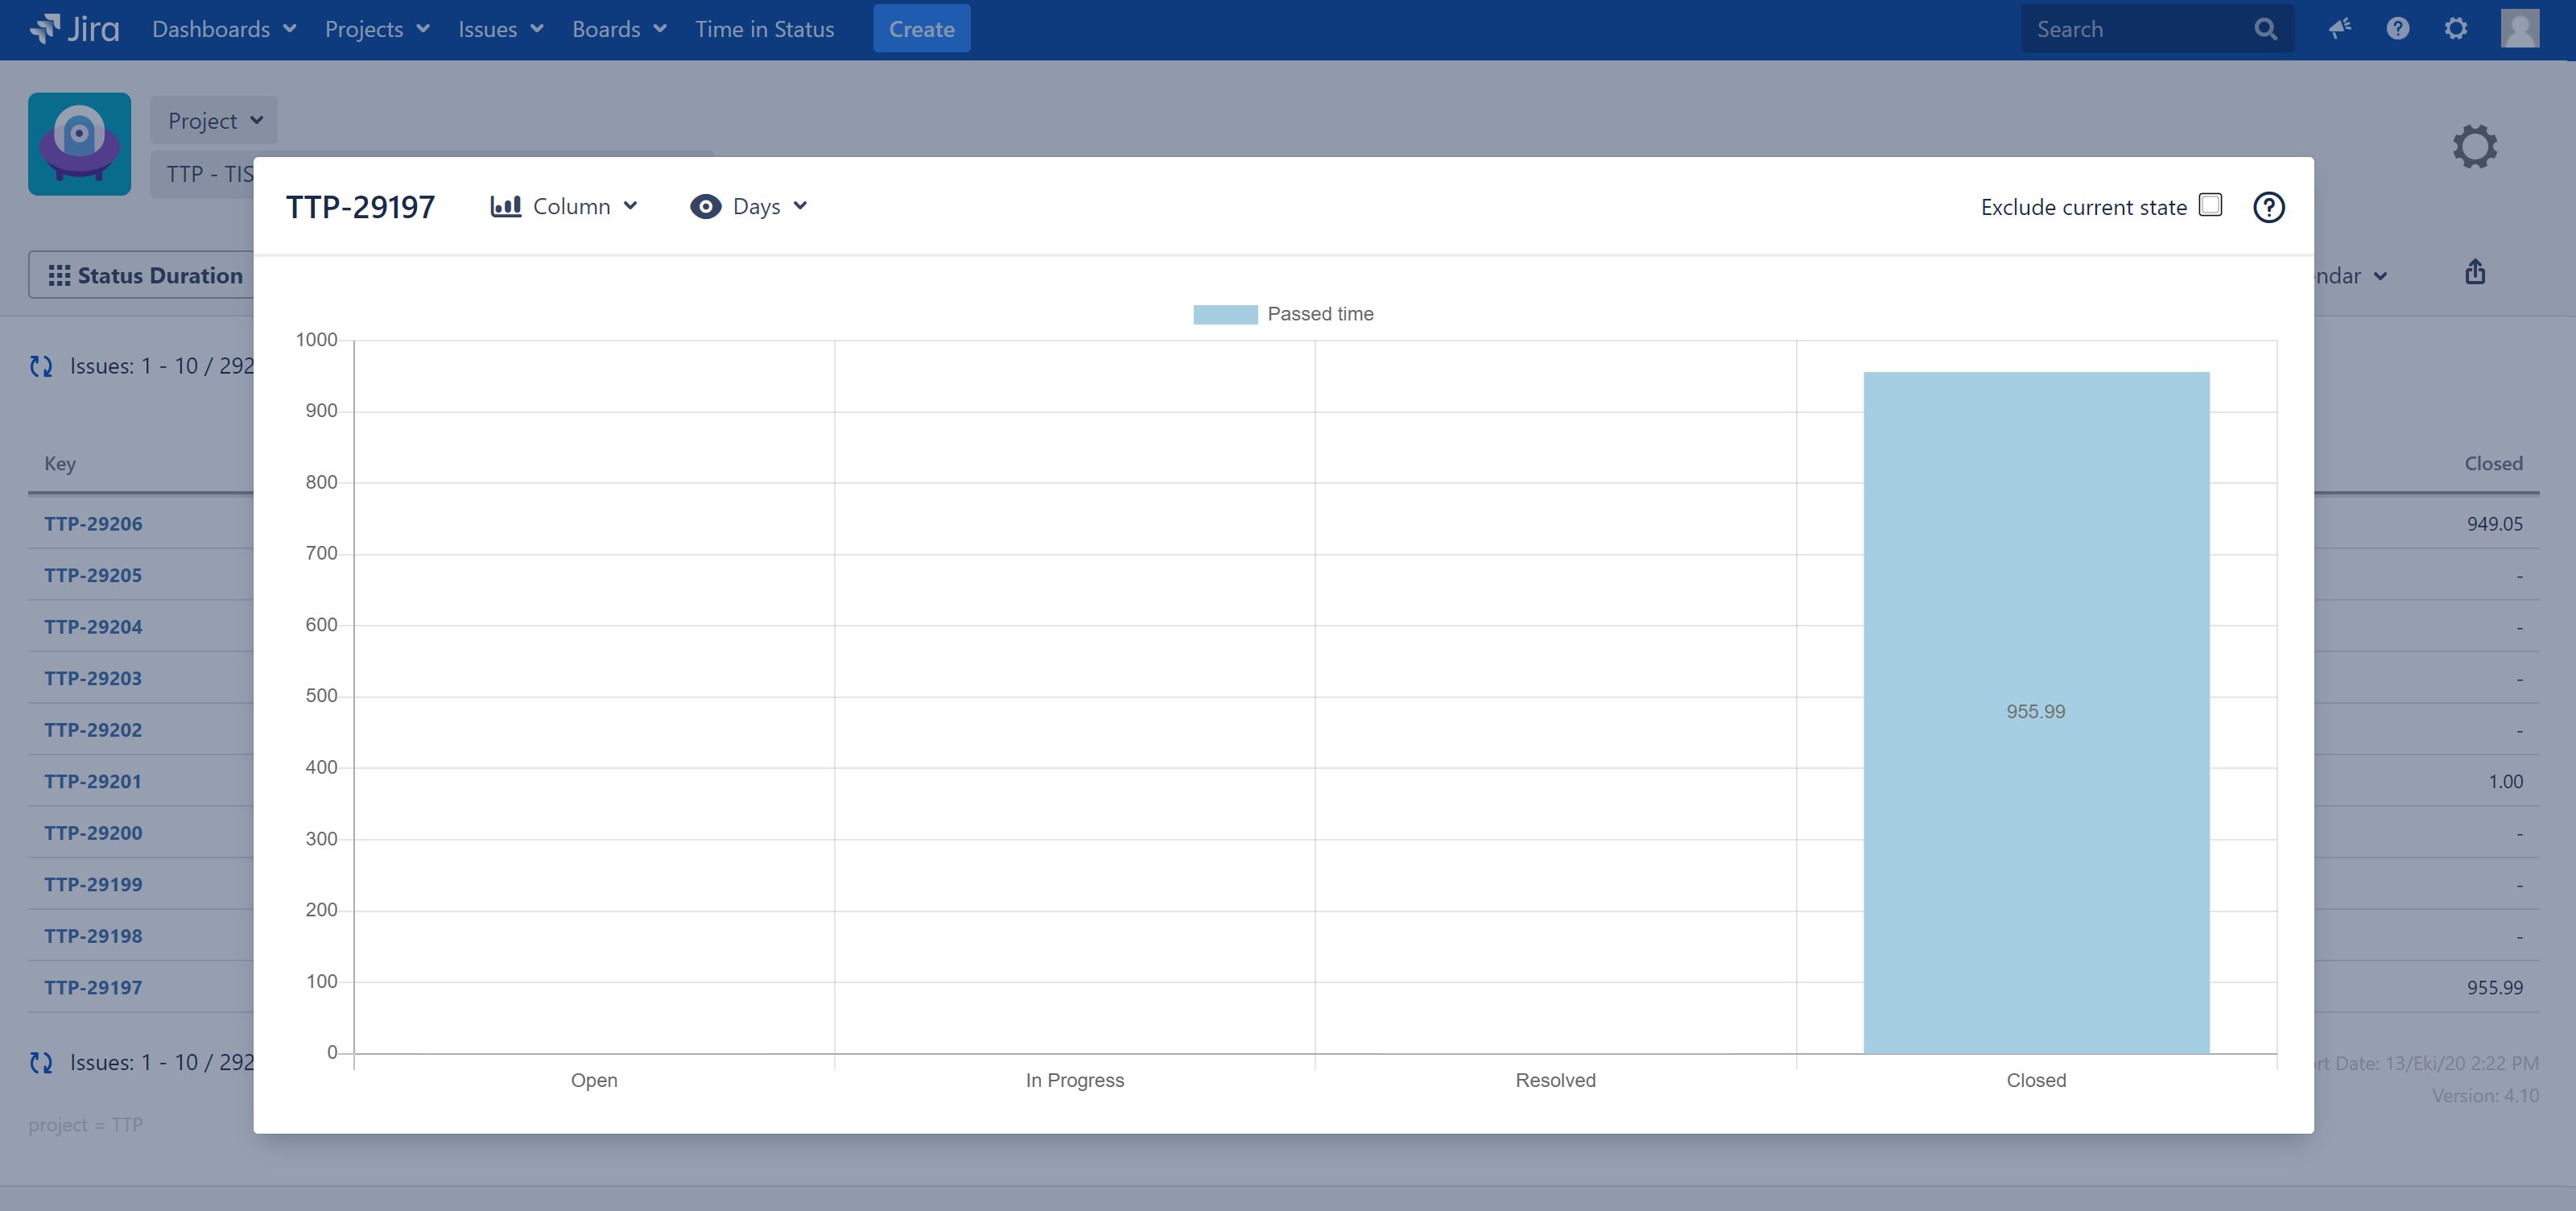
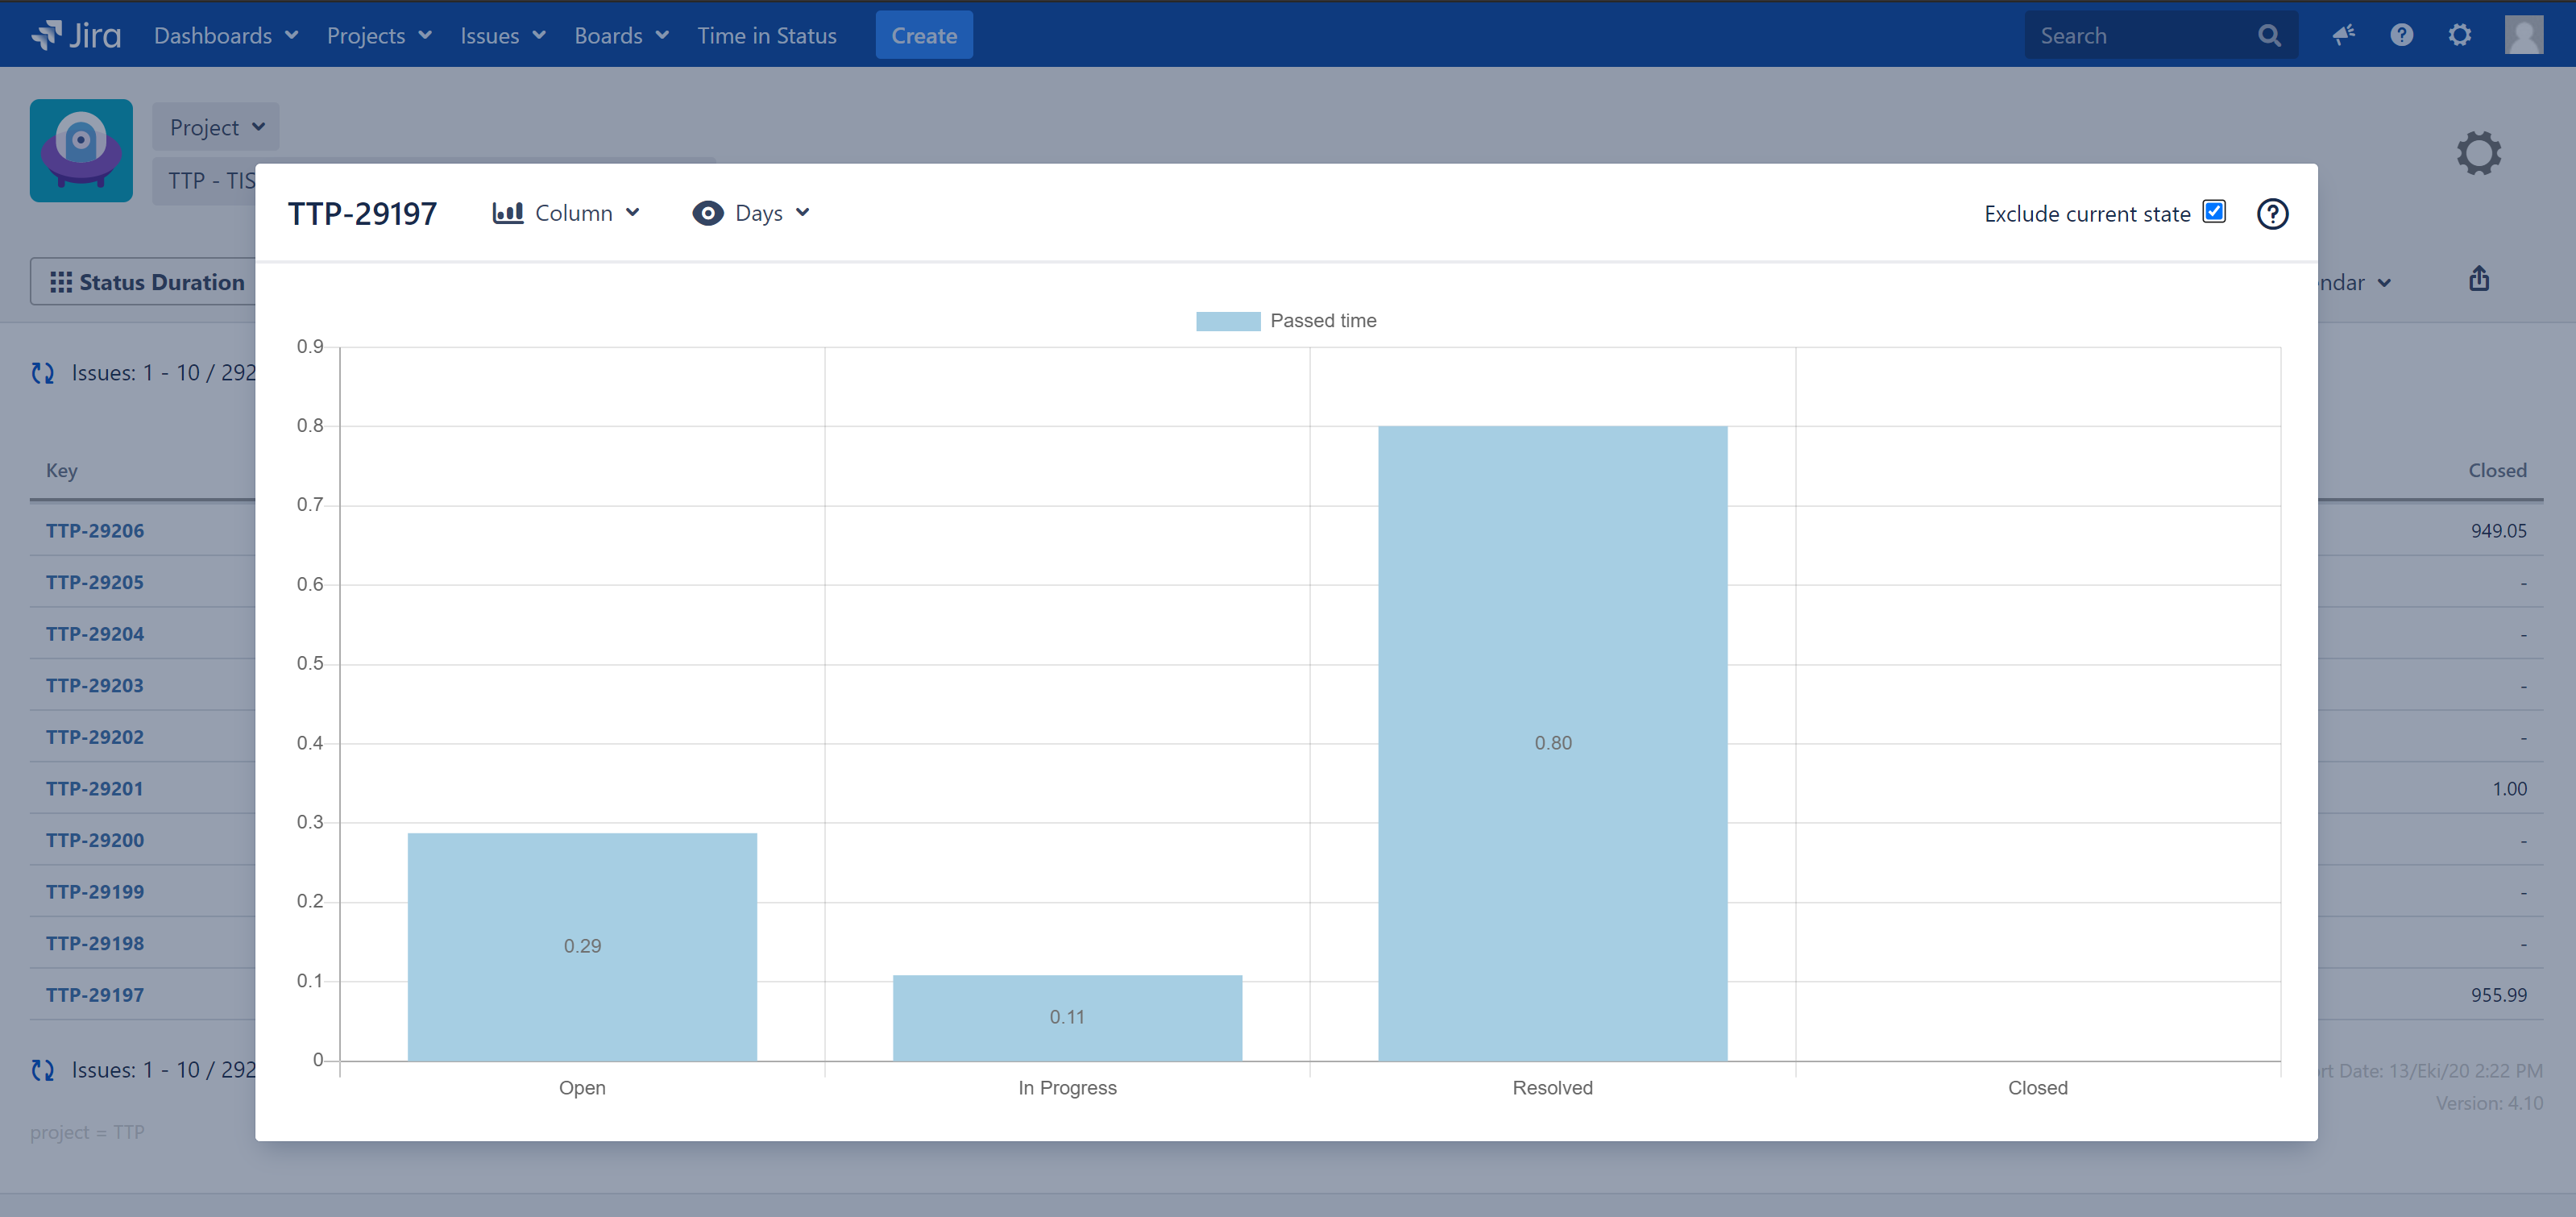
Please note that Exclude Current State does not exclude the latest status completely but rather excludes the duration since the latest status/assignee change in issue history. If the issue has visited Closed status more than once, the Closed column will still display a value grater than zero when Exclude Current State is checked.
If you want to exclude a status completely, you can uses the Statuses selection to select individual statuses to be included in the report.