
The SLA Success Rate Report calculates and displays SLA success rates across groups of Jira issues. Rather than showing individual issue-level SLA results like the SLA List Report, this report aggregates the data, giving you a higher-level view of how well your team is meeting its SLA targets across different dimensions such as project, customer, issue type, or time period.
This report is independent of Contract Definitions and Contract Reports. It is purely based on Jira Service Management's native SLA timers and can be used as a standalone performance analysis tool.
The real power of this report comes from its Group By functionality, which allows you to slice the data in almost any way you need, making it possible to identify trends, compare performance across teams or customers, and track improvement over time.
Running the Report
To run the SLA Success Rate Report, navigate to the SLA Success Rate Report screen from the TicketBook menu under Apps. Before the report can be generated, you must configure the following settings:
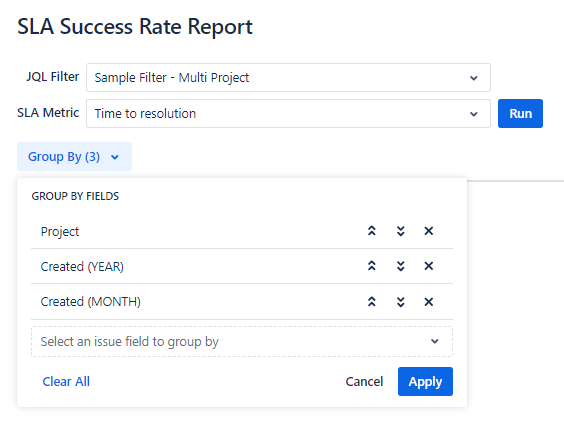
JQL Filter
Select a pre-saved Jira filter that defines the issues you want to include in the report. The filter must already exist in Jira before it can be selected here. Using a saved filter gives you precise control over the scope of the report, you can filter by project, customer, issue type, or any other Jira field.
If you do not have a suitable filter saved yet, create one in Jira's issue search and save it before running the report.
SLA Metric
Select the SLA timer you want to report on. The SLAs listed here are Jira Service Management's native SLA timers. Only SLAs available in your Jira instance will appear in this list.
Group By
Select one or more issue fields to group the results by. This is the key setting that determines how the report data is broken down and presented. You can leave this empty if you want a single overall success rate for all issues in the filter.
A large selection of system and custom field types are supported as Group By fields, including project, component, assignee, reporter, issue type, priority, and any custom field value. Date fields are broken down into their constituent parts,Year, Quarter, Month, Week, Day, and Hour, making it possible to group results by time and analyze trends over any period.
After configuring all settings, click Run to generate the report.
Report Structure
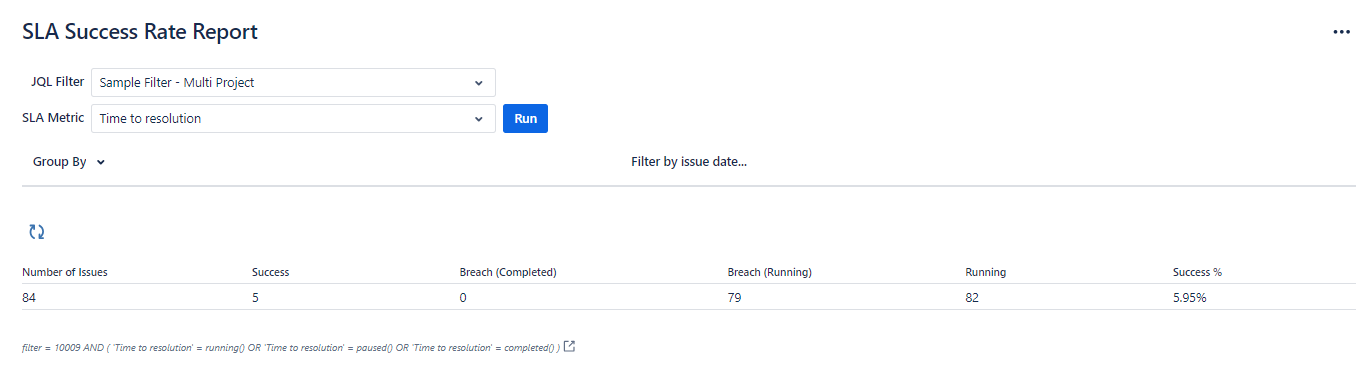
Without Group By Fields
When no Group By fields are selected, the report displays a single row showing the overall SLA success rate across all issues in the selected filter. This gives you a quick top-level view of your team's SLA performance.
With Group By Fields
When one or more Group By fields are selected, the issues in the filter are divided into groups based on the values of those fields. Each group is displayed as a separate row in the report, with its own success rate calculated independently.

Each row in the report includes the following data:
Total Issues
The total number of issues in that group that have a completed SLA result — either Success or Breach. Issues with still-running SLA timers that have not yet been breached are counted as Success.
Successful Issues
The number of issues in the group where the selected SLA timer was met successfully.
Failed Issues
The number of issues in the group where the selected SLA timer was breached.
Success Rate
The SLA success rate for the group, calculated as:
Success Rate = Successful Issues ÷ Total Issues × 100
This is the key metric of the report. A higher success rate indicates that your team is consistently meeting its SLA targets for that group. A lower success rate highlights an area that may need attention.
Using Group By for Trend Analysis
One of the most powerful uses of this report is trend analysis over time. By selecting a date field, such as Created Date, as a Group By field and choosing a time granularity such as Month or Week, you can see how your SLA success rate has evolved over time.
This makes it easy to answer questions like:
-
Has our SLA performance improved since we added more agents last quarter?
-
Which month had the most SLA breaches this year?
-
Is there a particular day of the week where we consistently struggle to meet SLA targets?
You can also combine multiple Group By fields, for example, grouping by both Month and Project, to get a more granular breakdown of performance trends across different parts of your service operation.
Filtering by Date
The issues returned by the selected filter can be further narrowed down by date using the date selection on the toolbar. You can filter by:
-
Created date — show only issues created within a specific date range
-
Updated date — show only issues that were last updated within a specific date range
-
Resolution date — show only issues that were resolved within a specific date range
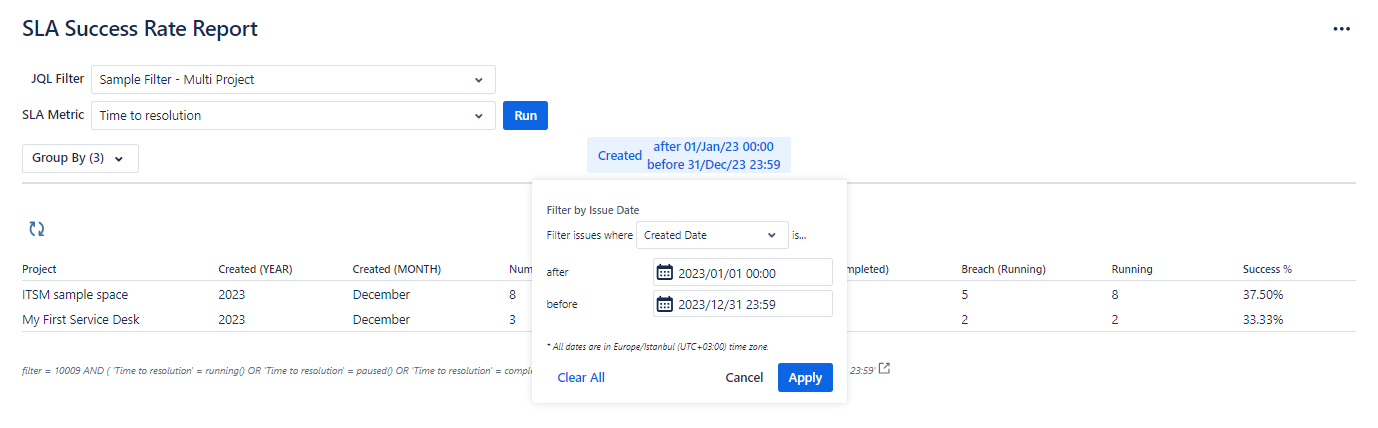
This is particularly useful when you want to focus the report on a specific time window, for example, calculating the SLA success rate for all issues raised during a particular contract period.
Exporting the Report
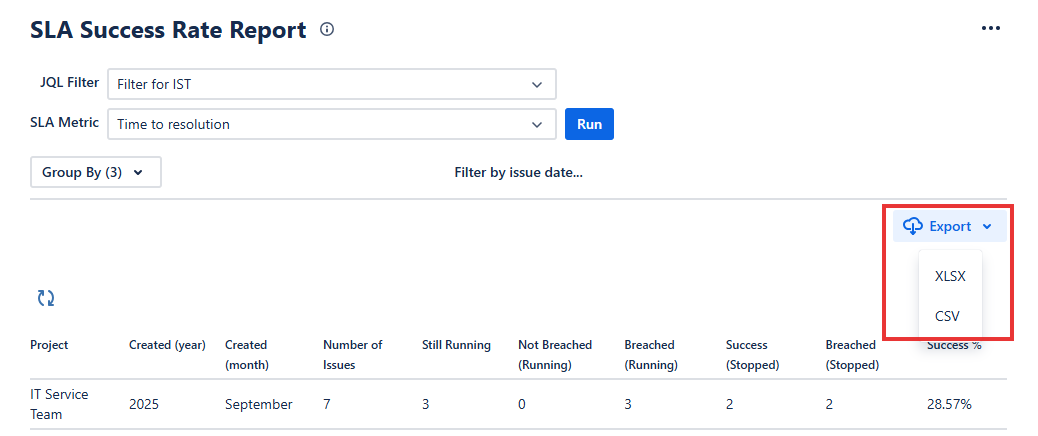
The SLA Success Rate Report provides export functionality to allow users to download report data in different formats.
Select the Export button located at the top-right corner of the report to choose the preferred option.
|
Format |
Description |
|---|---|
|
XLSX |
Exports the report in Excel format including all visible columns in the current view. |
|
CSV |
Exports the report data as a CSV file. |
Related
For viewing individual issue-level SLA results rather than aggregated success rates, see SLA List Report.
For tracking SLA success rates as part of a service contract, see Contract Report.