
The Historic Query Report in Jira Cloud allows you to view and analyze the results of a JQL query as they appeared at a specific point in time. It provides a structured snapshot of work items and their field values, helping you track how query results have changed over time.
This feature is particularly useful when you want to understand:
-
What the issue data looked like at a past date.
-
How selected fields’ values were at that moment.
-
Which issues existed or did not exist on that date.
Understanding Details
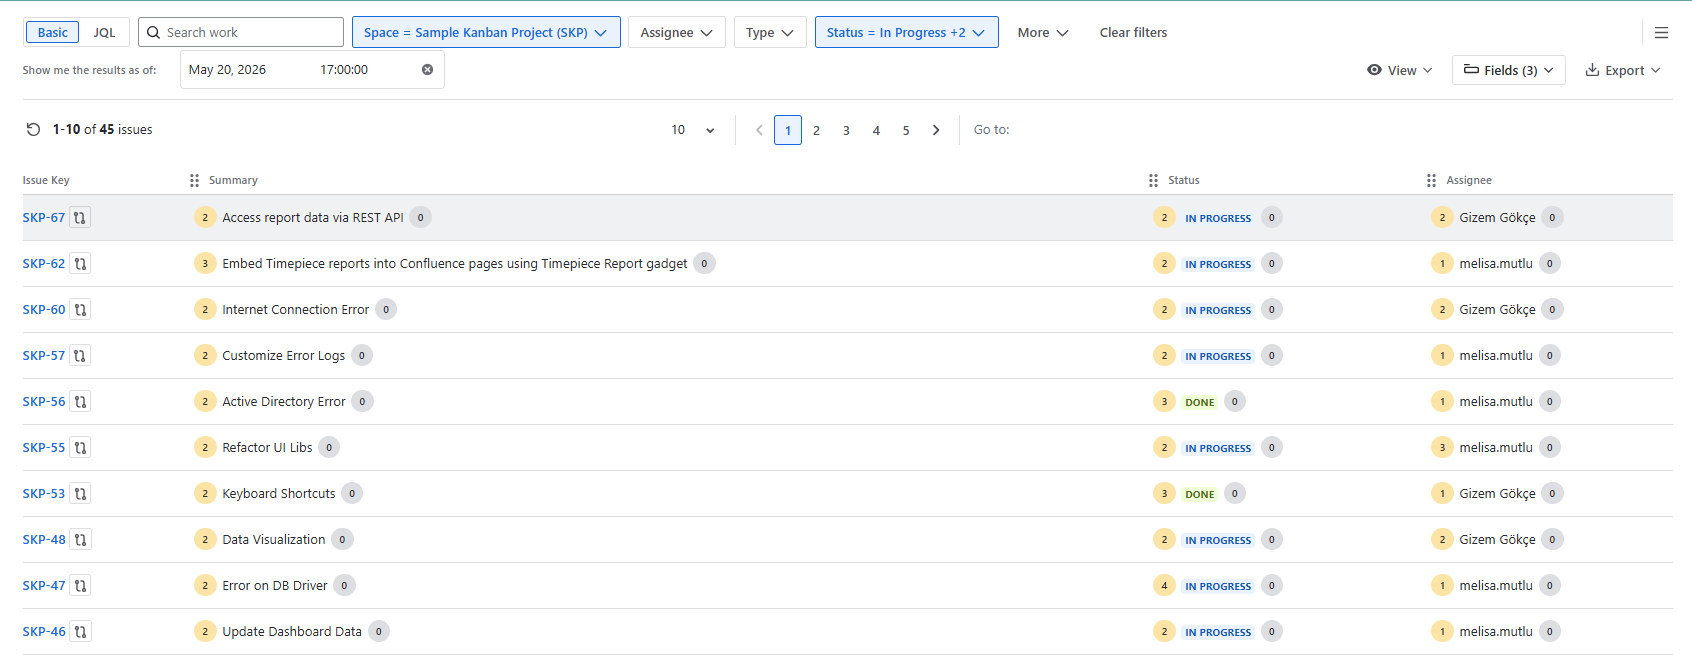
Each row in the report represents a work item returned by the JQL query. Selected columns, such as Issue Key, Summary, Status, and Assignee, display their values at the specified date and time.
Users can customize the report by selecting fields and rearranging their order to match analysis needs.
This flexibility helps users review historical work item states, track progress over time, and analyze changes in query results.
Accessing Historic Query
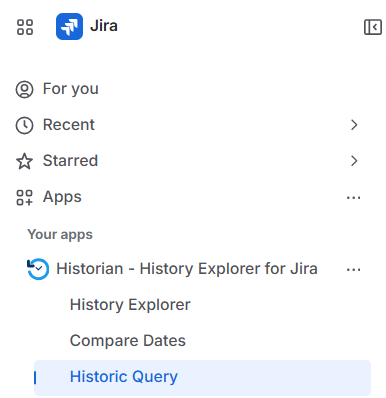
This report is accessed via a dedicated screen under the Historian app in the menu, titled Historic Query.
Navigate to Apps → Historian - History Explorer for Jira → Historic Query to open it.
Issue Filtering Options
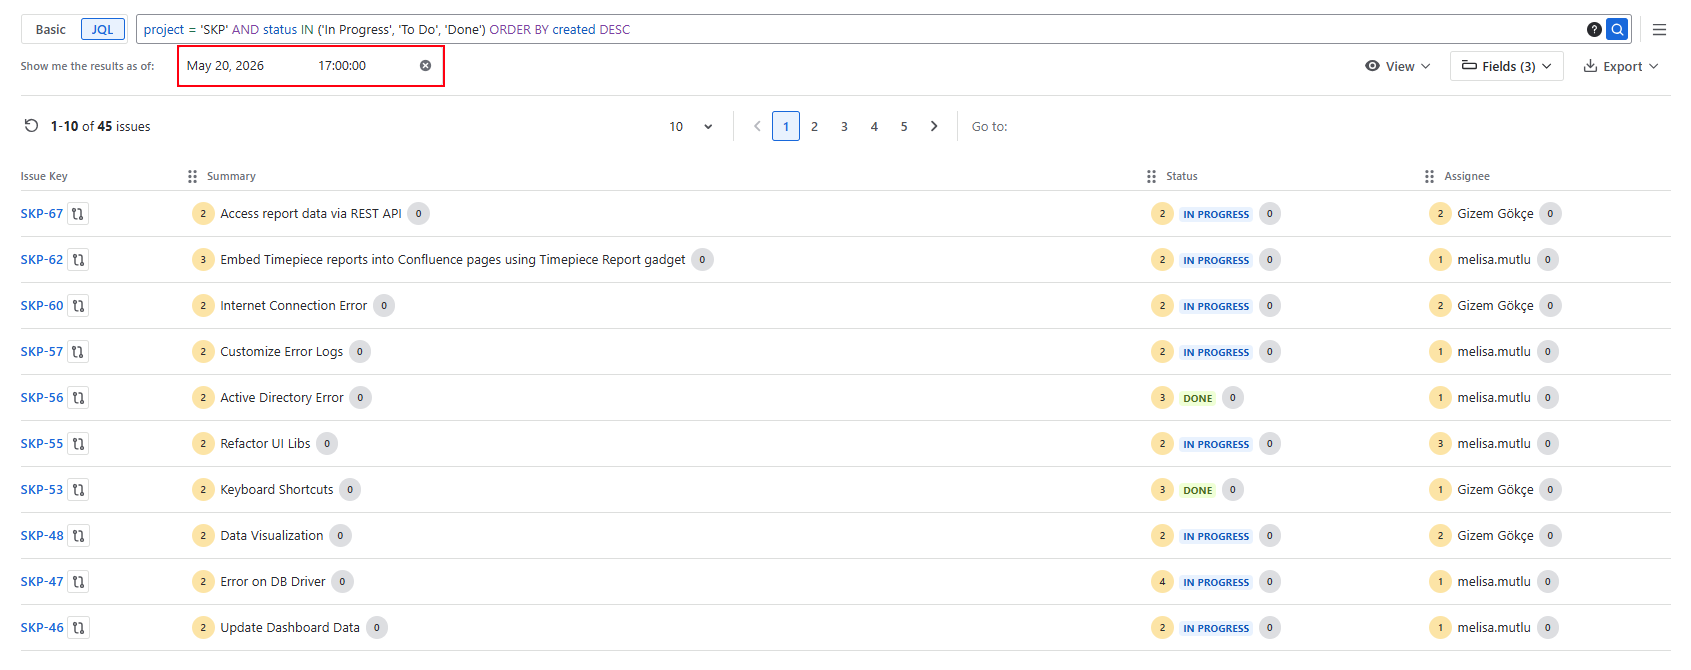
At the top of the page, you define the set of issues you want to analyze using either a Basic Filter or a JQL Filter option. Both options allow you to select the relevant issues and view their state at a specific point in time.
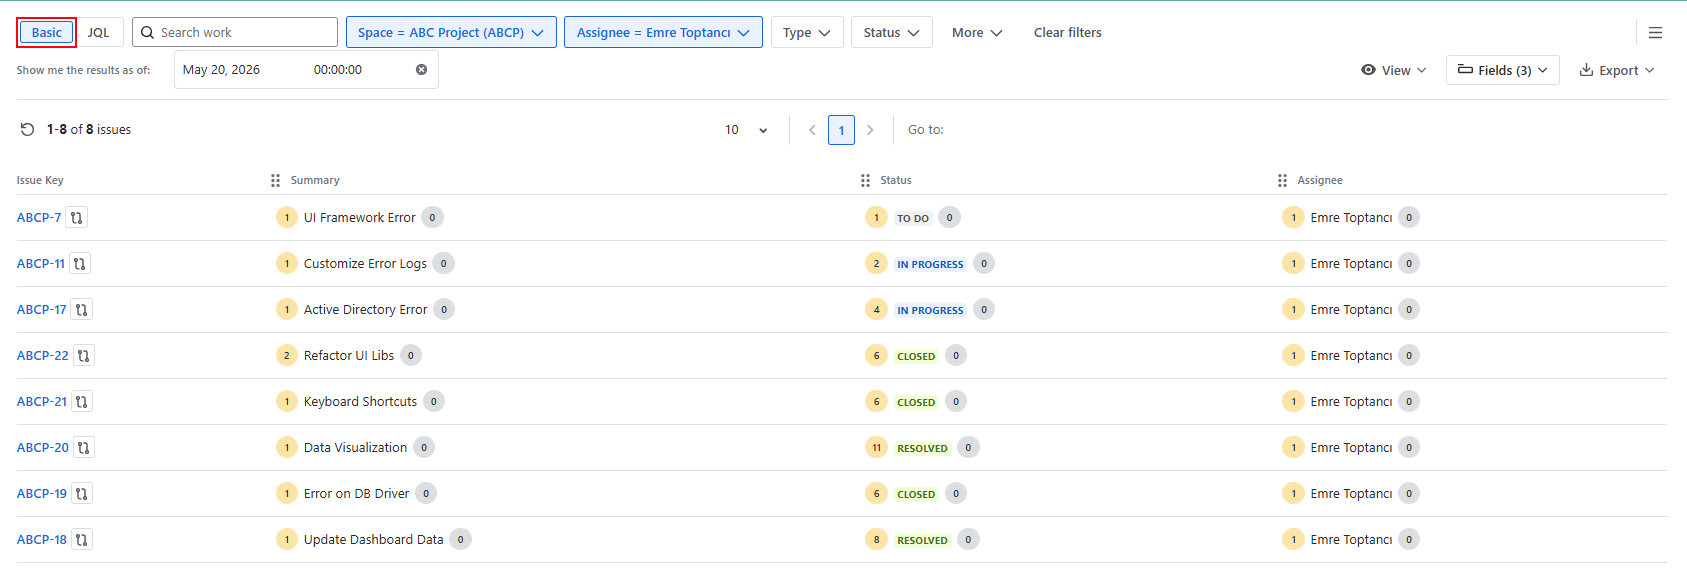
Basic Filter
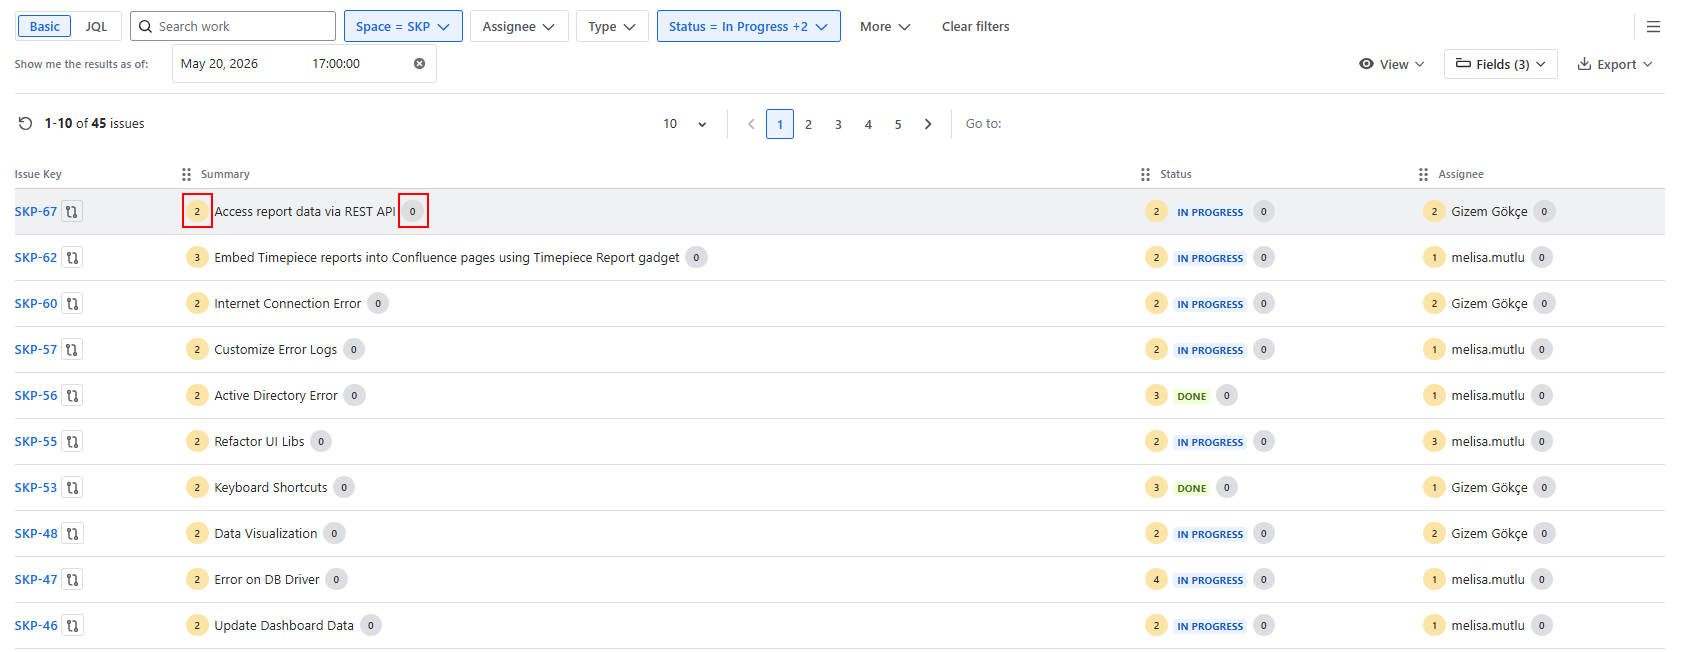
The Basic filter provides a quick, visual way to filter work items using predefined fields such as project, status, assignee, and priority. It allows users to refine results and display relevant issues based on the selected criteria.
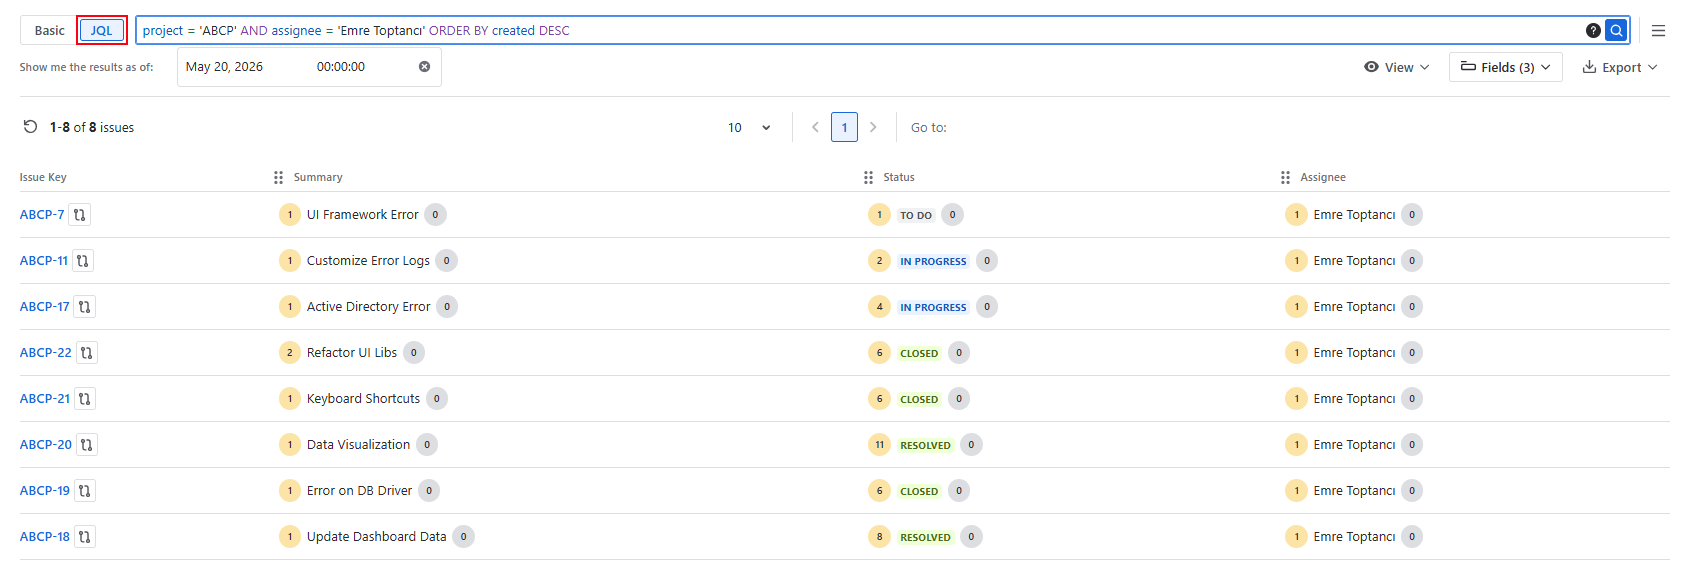
JQL Filter
The JQL filter enables advanced searching through custom Jira Query Language queries. It supports more complex conditions than the Basic filter and is useful when standard filtering options are insufficient.
Show me the Results As Of
This field allows users to select a date for the Historic Query Report. The report displays issues and their field values as they appeared on that date, providing a snapshot of historical data.
-
If a queried work item did not exist on the selected date, it is still listed, but its fields remain empty and a message indicates it had not yet been created.
-
If no date is selected, the report uses the current date and time and shows the latest issue states.
Viewing Change Counts and Details
In the report table, numeric badges next to each field represent how many times that field has changed for the specific issue from the selected date until now.
How to Interpret the Change Counts
-
Each number indicates the total count of changes made to that field since the date you chose in the “Show me the results as of” filter.
-
This gives a quick overview of the activity and volatility of fields on that issue.
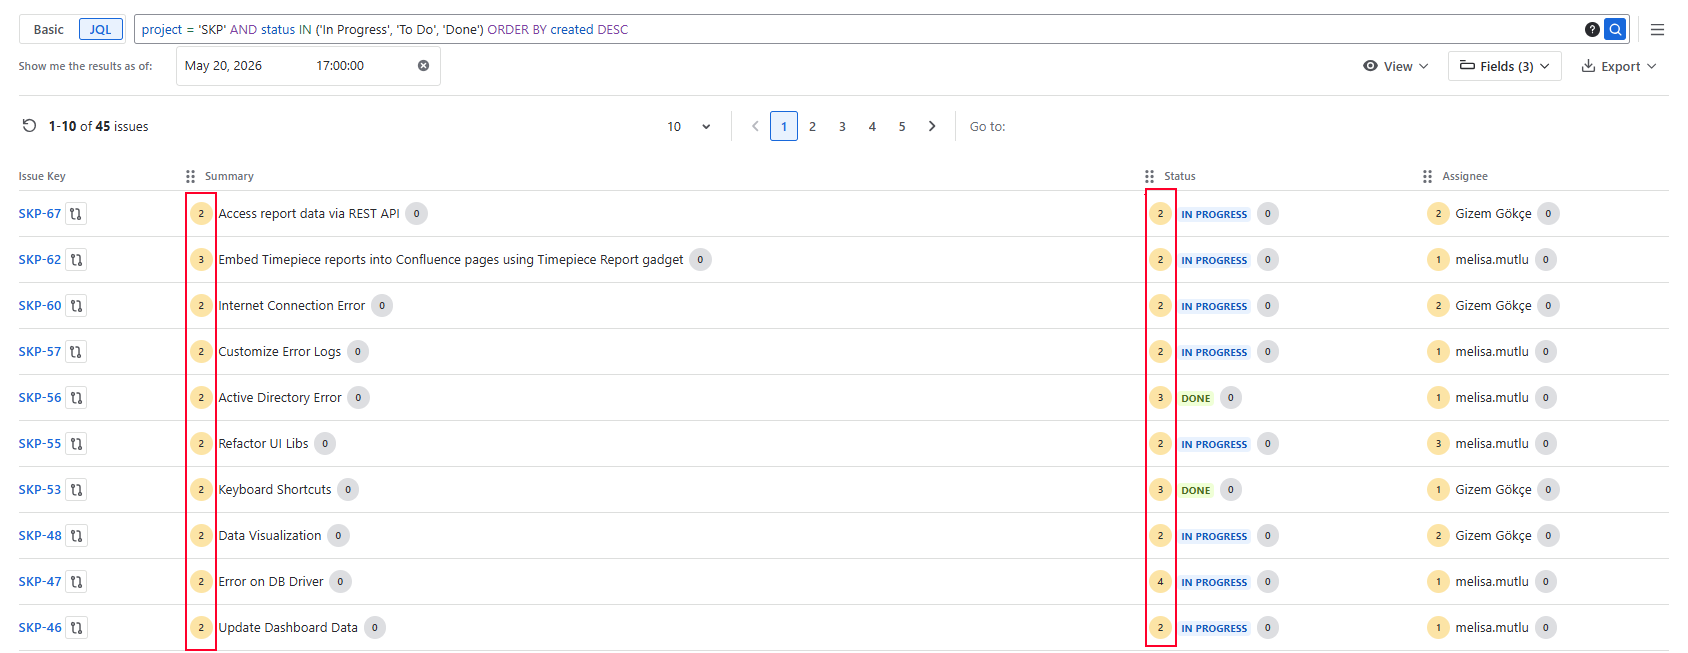
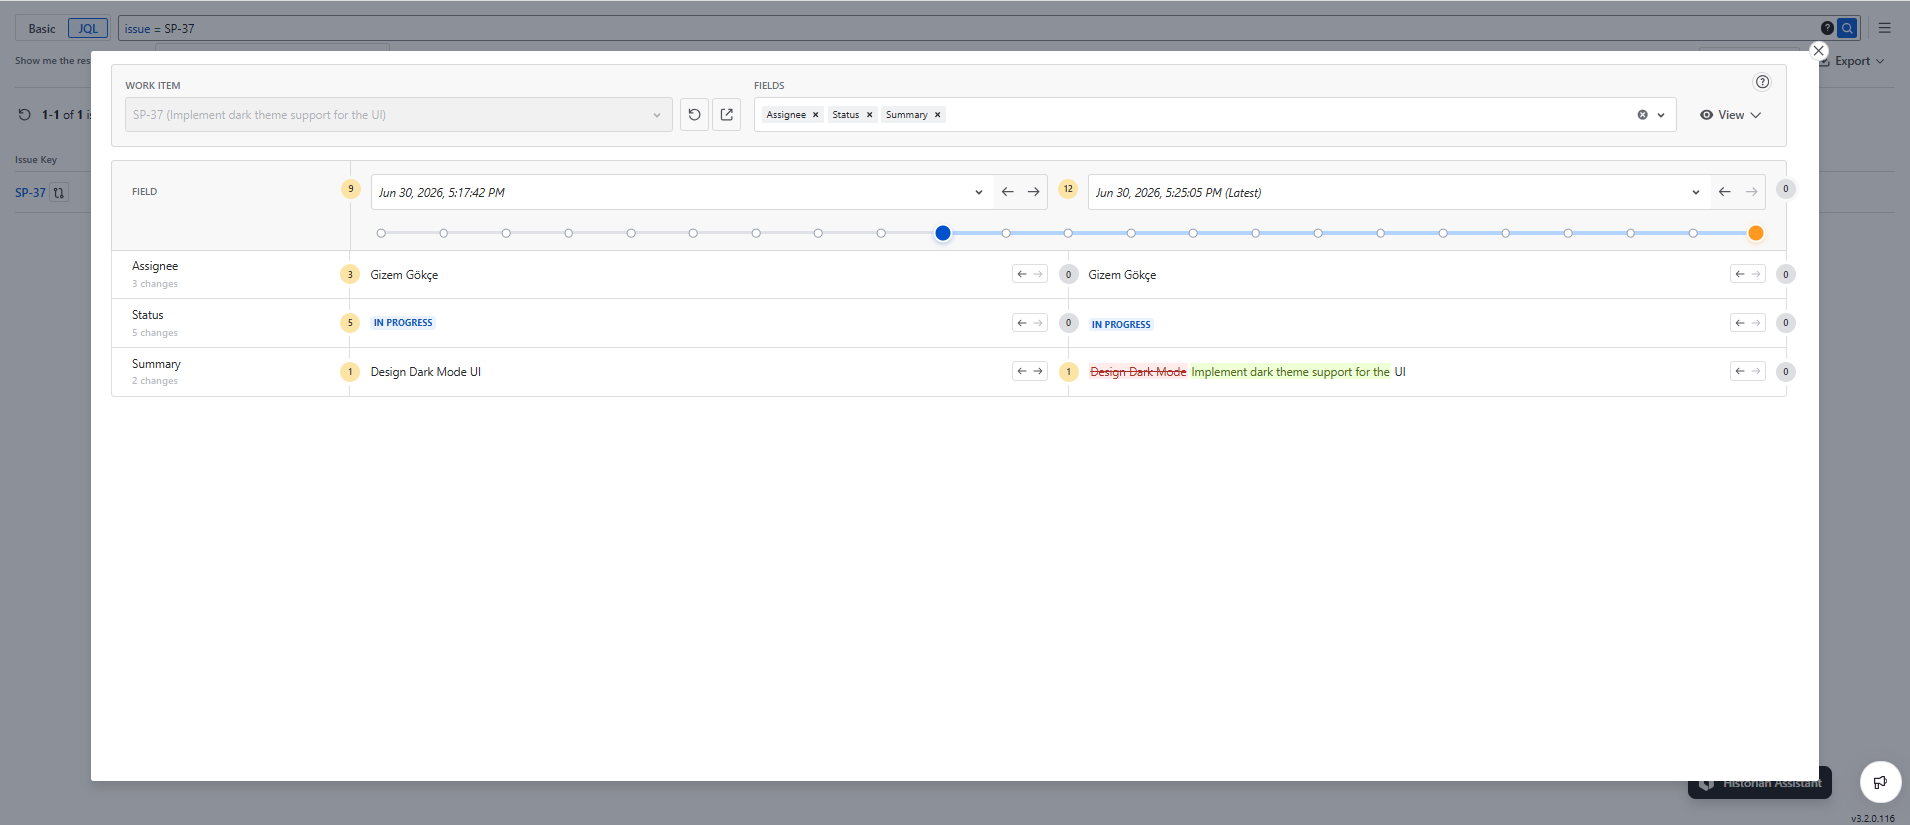
The numeric badges displayed at the beginning and end of the values indicate the number of changes made.
-
The badge on the left shows how many changes were made before the selected date.
-
The badge on the right shows how many changes were made after the selected date.
Grey indicates that there is no value, while yellow indicates that a value exists.
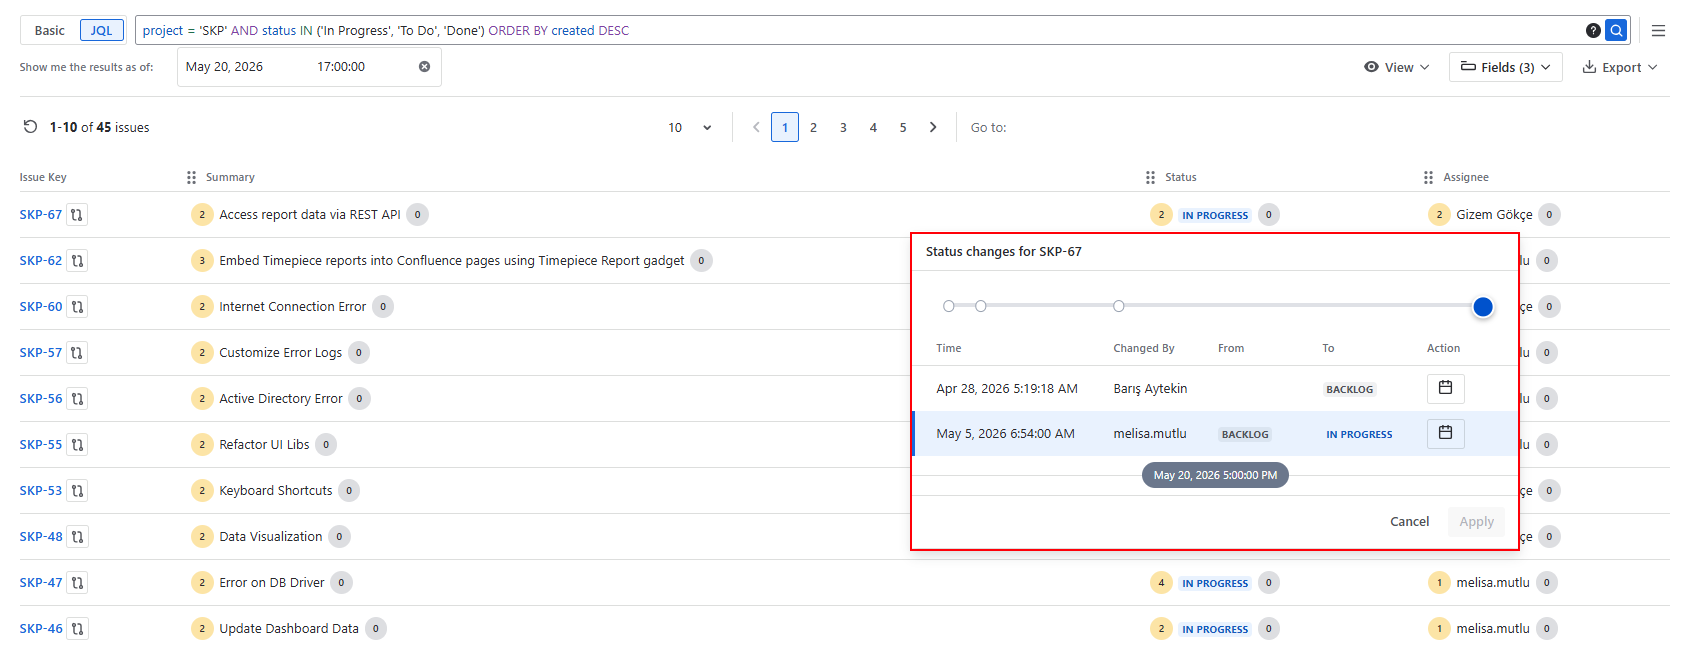
Accessing Change Details
Clicking on the numeric badge opens a detailed change history panel for that field on the selected issue.
-
The panel shows a timeline of all changes made to that field, including:
-
The exact date and time of each change
-
The user who made the change
-
The old value (From) and the new value (To) for each update
-
Compare Dates
Compare Dates is a report that shows the field values of a Jira work item at two different points in time, making it easy to identify what changed, when, and which fields were affected.
See Compare Dates page for details about this view.
Export
You can export the generated report in XLSX or CSV format.