
Overview
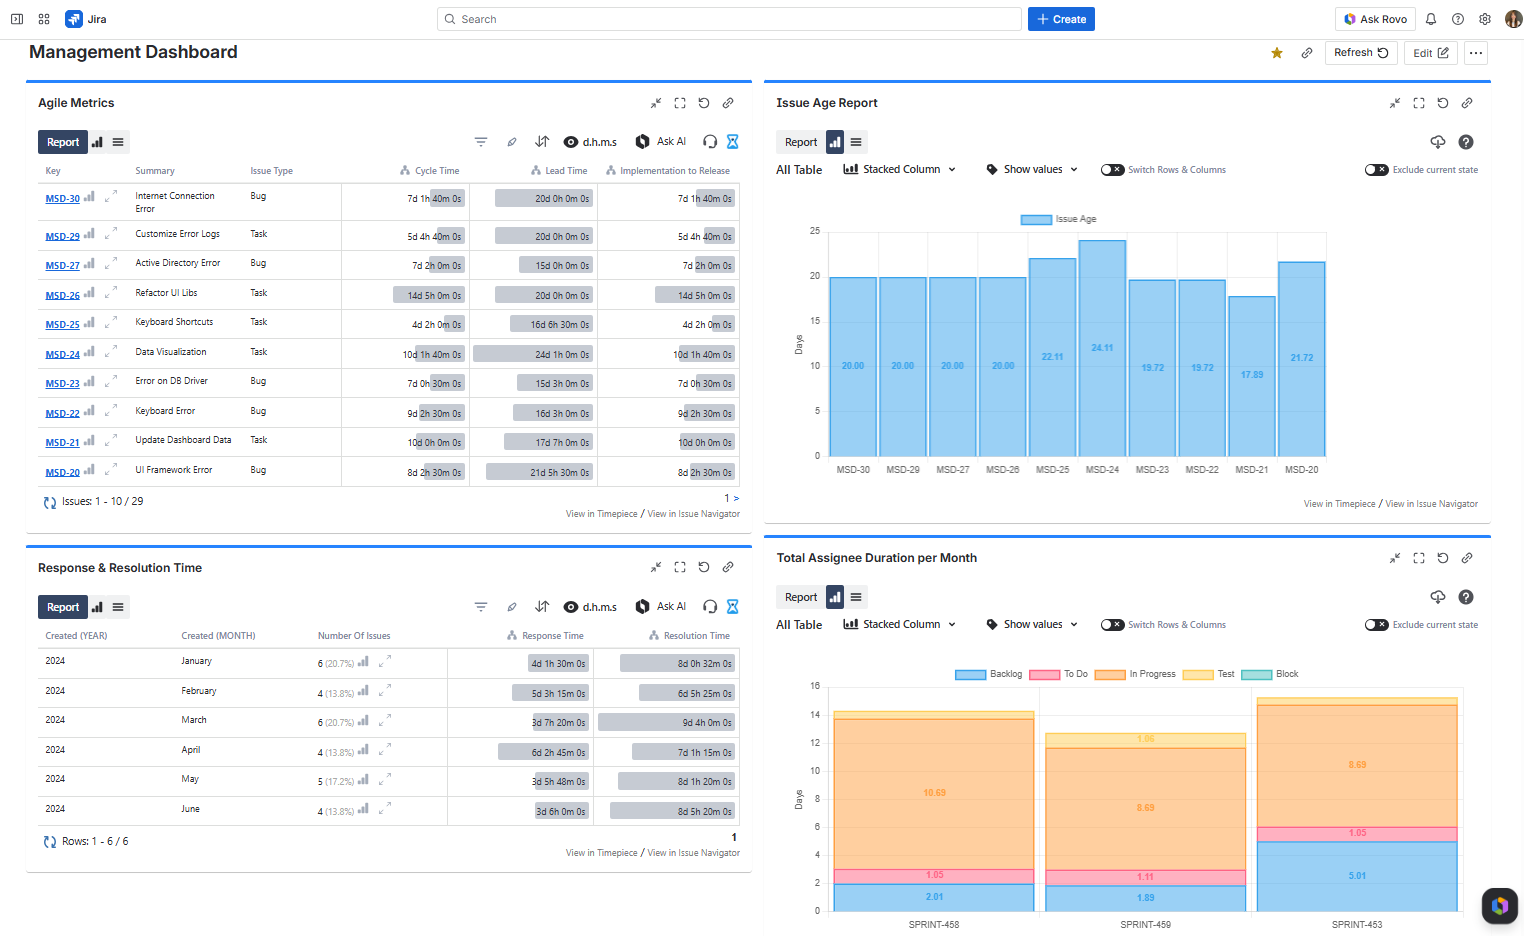
The Timepiece - Time in Status for Jira Report gadget allows you to display Timepiece reports as tables or charts on Jira dashboards.
How to add a Timepiece Gadget to your Jira Dashboard?
Timepiece gadgets have a maximum issue limit per report. If your JQL query or filter returns more issues than the allowed limit, the gadget will not generate the report. To work around this, try narrowing your query by applying additional filters or reducing the date range.
To add the Timepiece - Time in Status for Jira Report gadget:
-
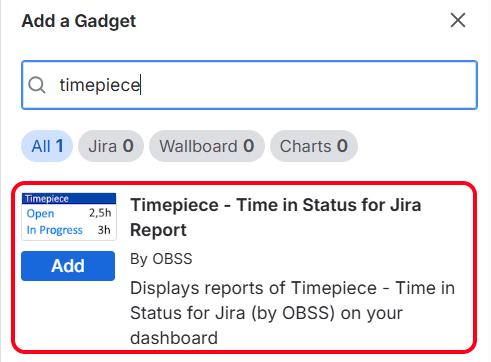
Go to your dashboard and press the Add gadget button on the top right.
-
Find the gadget named Timepiece - Time in Status for Jira Report on the list and press the Add gadget button next to it.
-
You should now see the gadget on your dashboard.
If you can't see the gadget on the list, then you need to update the app by going to the Manage Apps page of your Jira. You will see an Update button under Timepiece - Time in Status for Jira. Click it and refresh the page. You should now see the gadget on the list.
You can add multiple gadgets with different configurations.
Gadget Configuration
In order to get reports via the gadget, you must first configure and save the gadget settings.
To configure a Timepiece - Time in Status for Jira Report gadget, you must have permission to edit the dashboard.
Gadget Configuration Options
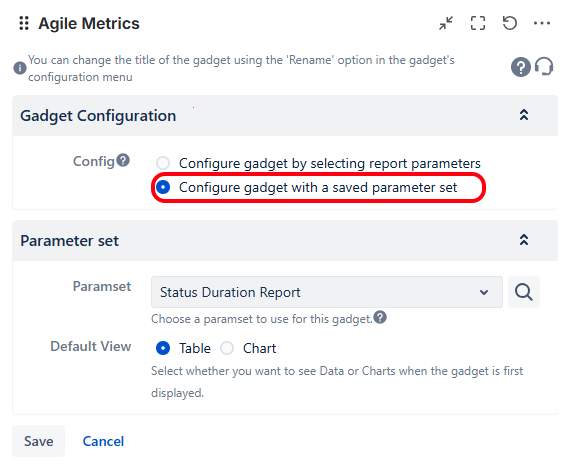
When configuring a Timepiece gadget, you can choose one of the following options at the top of the configuration panel:
-
Configure gadget by selecting report parameters
Manually select each report parameter to build your configuration from scratch. -
Configure gadget with a saved parameter set
Select one of your saved parameter sets to configure the gadget easily.
Configure gadget by selecting report parameters
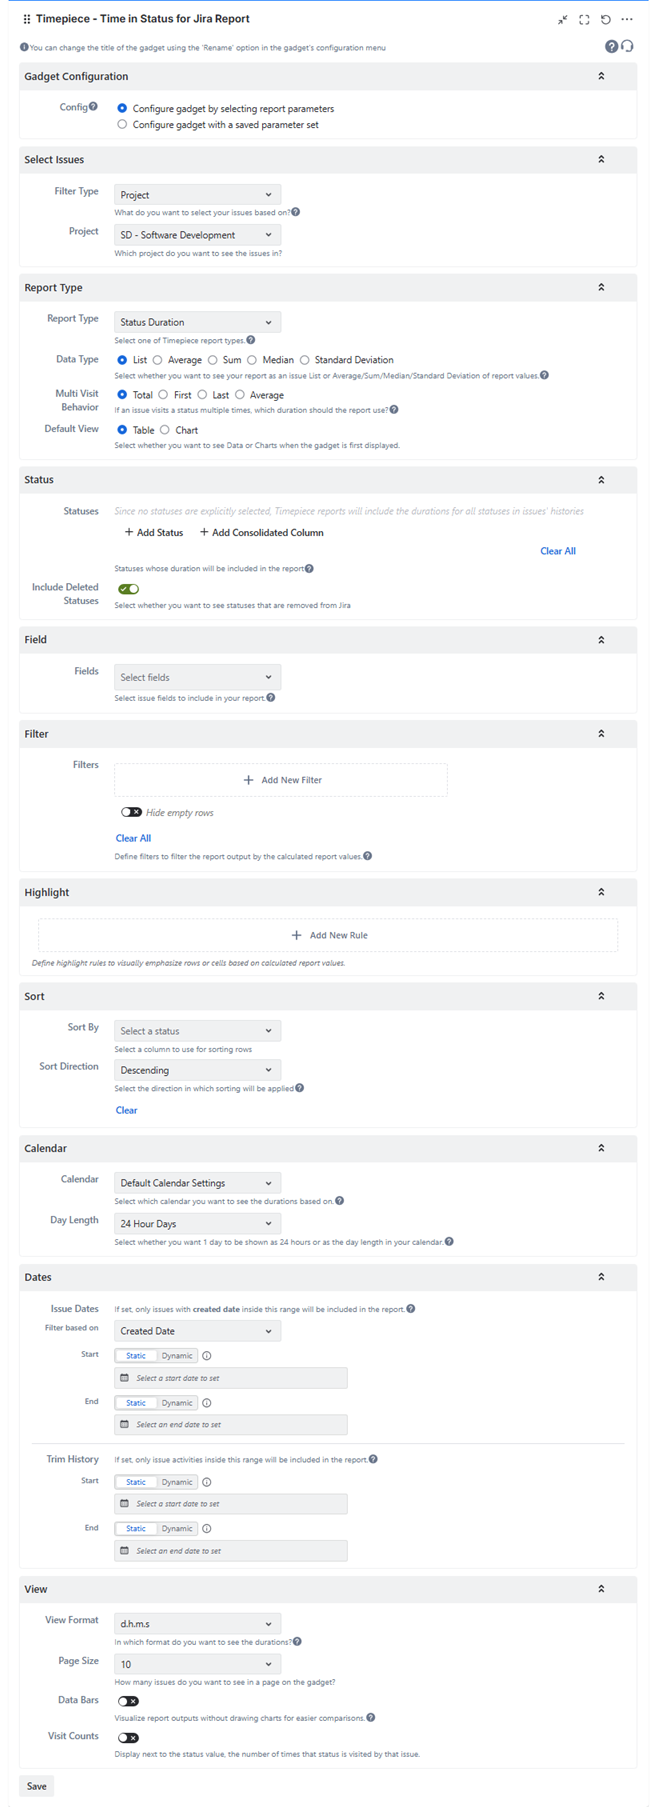
Select Issues
Define how the issues to be included in the report will be selected. Click here for details.
Report Type
Define the column structure of the report. Click here for details.
Select whether you want to see your report as an issue list or Average/Sum/Median/Standard Deviation of report values. Click here for details.
Select whether you want to see Data or Charts when the gadget is first displayed.
Statuses
Select the statuses that you want to see in the report.
If you don't select any statuses, Timepiece will show all statuses it encounters in issue histories.
You can define consolidated statuses as well. Click here for details.
Assignees
Select the assignees that you want to see in the report. (For assignee-based reports)
If you don't select any assignees, Timepiece will show all assignees it encounters in issue histories. Click here for details...
DBS Metrics
Define the metrics that will be used for the Duration Between Statuses report type. Click here for details.
Multi Visit Behavior
Select if you want to see the First, Last, Total, or Average duration of status visits for Status Duration reports. Click here for details.
Field
Select issue fields to include in your reports as columns. Click here for details.
Sort
For supported report types, select the column of the report that you want to sort by and select the sort direction. Click here for details.
Filter
For supported report types, define the filter that will be used to filter report data based on report values. Click here for details.
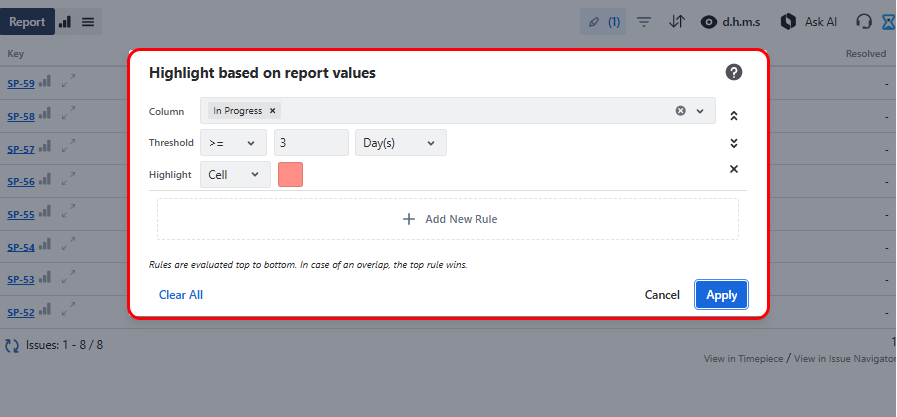
Highlight
For supported report types, select the cell or row of the report that you want to highlight and define the highlighting rules based on report values. Click here for details.
Calendar
Define the calendar and day length which times will be calculated based on. Click here for details.
Dates
Date filtering can be based on Created Date, Resolution Date, or Update Date of issues.
Filter Dates and Trim History Dates can each be set as static (a fixed date selected from the calendar) or dynamic (a date automatically calculated based on the current time whenever the report is run). The Start Date and End Date of each range can be configured independently. Click here for details.
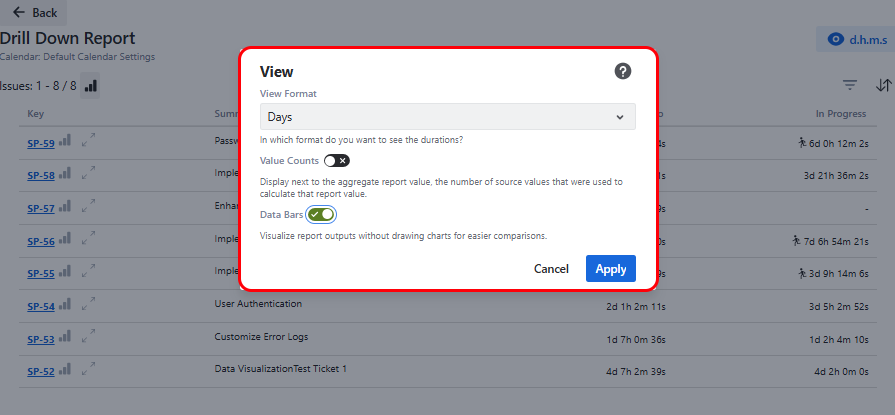
View
Define the format in which durations will be displayed. Click here for details.
Select how many issues will be shown per page.
Enable / Disable Data Bars for the gadget.
Enable / Disable Visit Counts for the gadget.
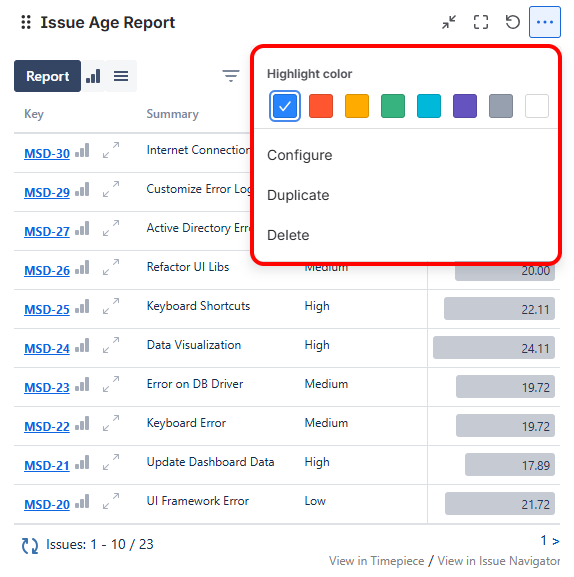
If you want to change the gadget settings later, click the three dots at the top right of the gadget and select Configure from the menu. You can also duplicate, delete the gadget, or change its color from this menu.
Configure gadget with a saved parameter set
Use a saved parameter set to quickly configure the gadget. The gadget will use the exact report parameters defined in the selected set.
If you update the parameter set later from the main Timepiece screen, those changes will automatically be reflected in all gadgets that use it.
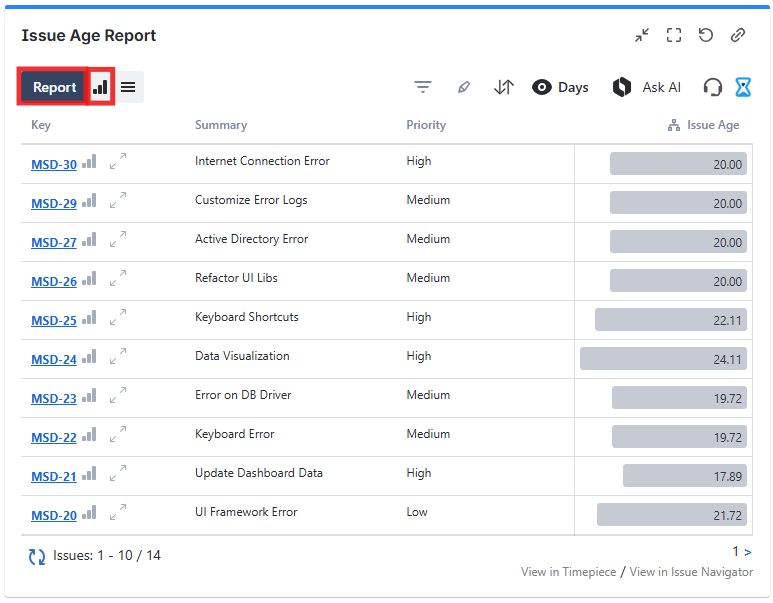
Gadget Output
Once the gadget is configured and saved, it will process the matching issues and display the report directly on your Jira dashboard. The output can be rendered as a data table or a chart, depending on your configuration.
Output Formats
You can switch between table and chart views directly from the gadget without editing the configuration by simply clicking the Report and Chart buttons on the top-left side of the gadget.
Issue Limit
Timepiece gadgets have a maximum issue limit per report. If your JQL query or filter returns more issues than the allowed limit, the gadget will not generate the report. To work around this, try narrowing your query by applying additional filters or reducing the date range.
Gadget Functions
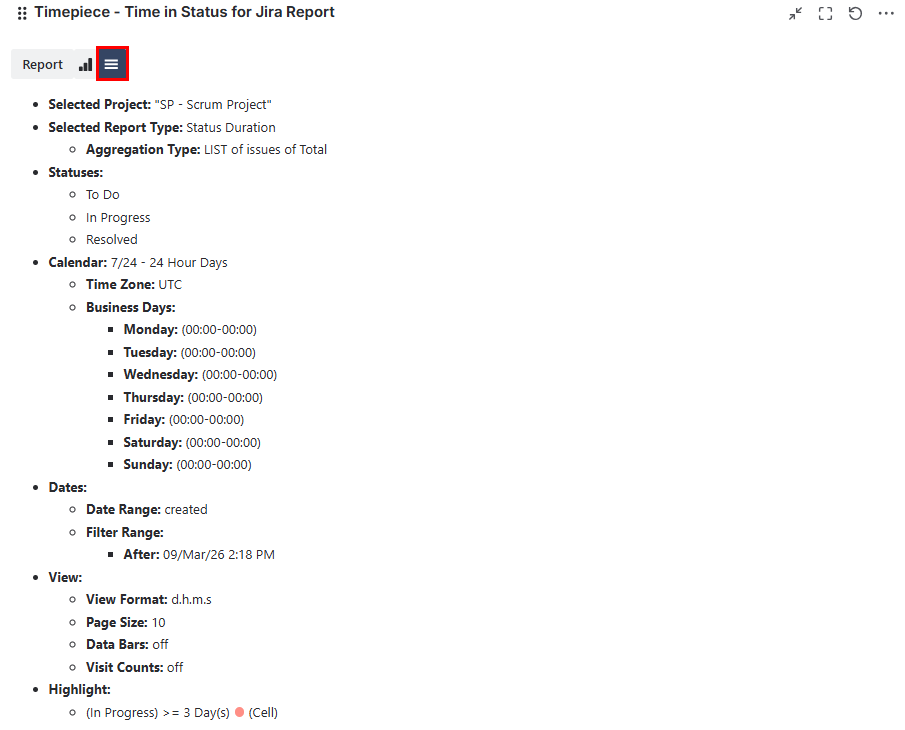
Report Parameters
The Report Parameters tab allows users to view the parameters of the report in the gadget without the need to edit the gadget.
The user does not need edit permissions on the dashboard to access this information. All users with view permissions can see report parameters here.
Charts and Status History Expanded Report
For selected report types, the gadgets will display Chart and Status History Expanded buttons which will display the selection within the gadget.
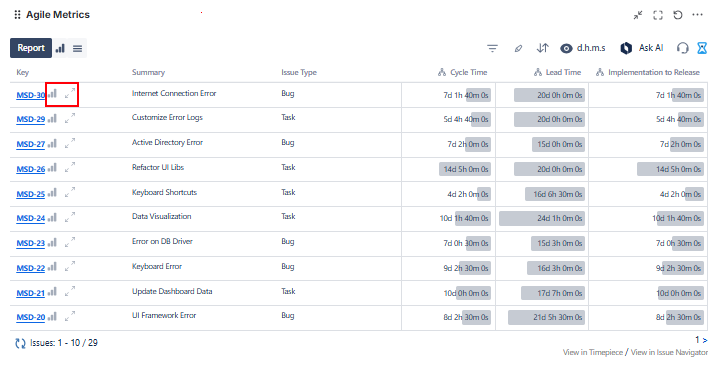
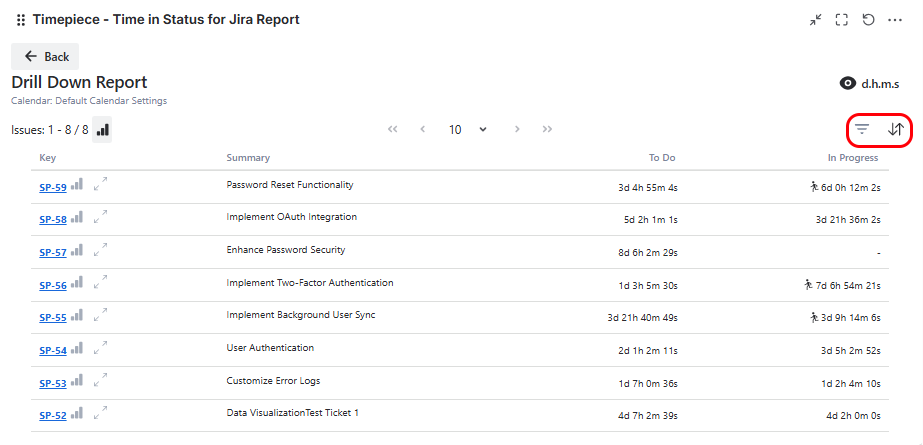
Drill Down
While working with Aggregate Reports (Average, Sum, Median, Standard Deviation), you can use the drill-down function on each report row to see the issues that made up that aggregate row.
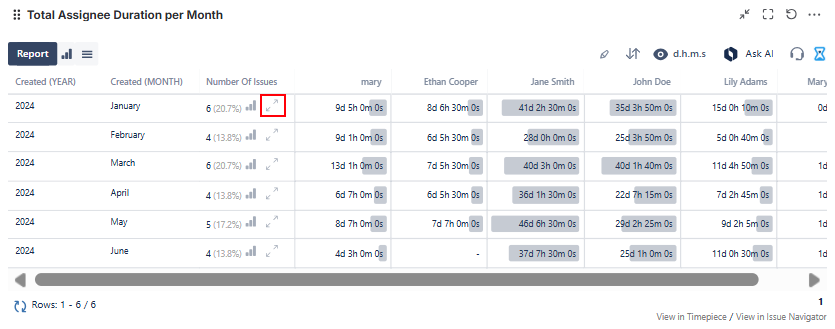
Advanced Table Tools
Users can sort, highlight, and filter directly on the screen without editing the gadget settings.
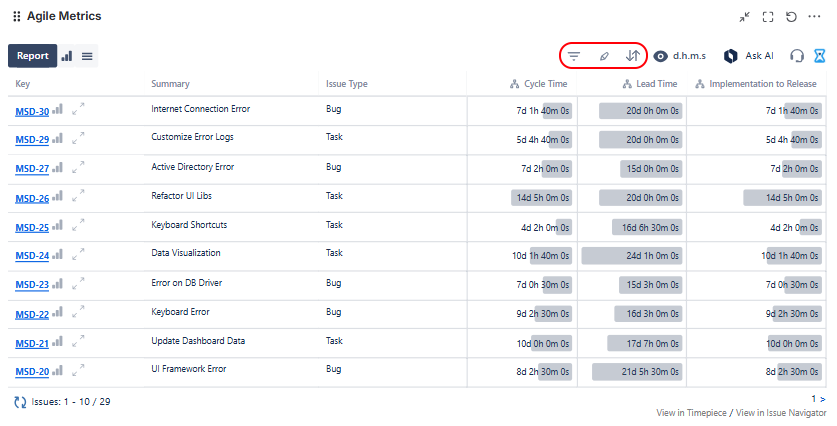
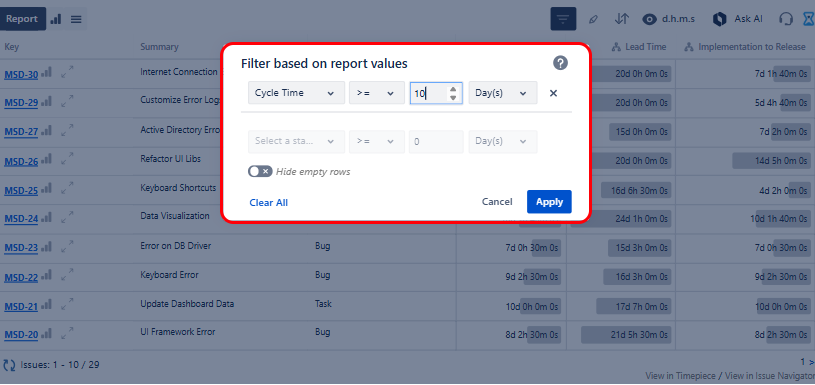
Filter
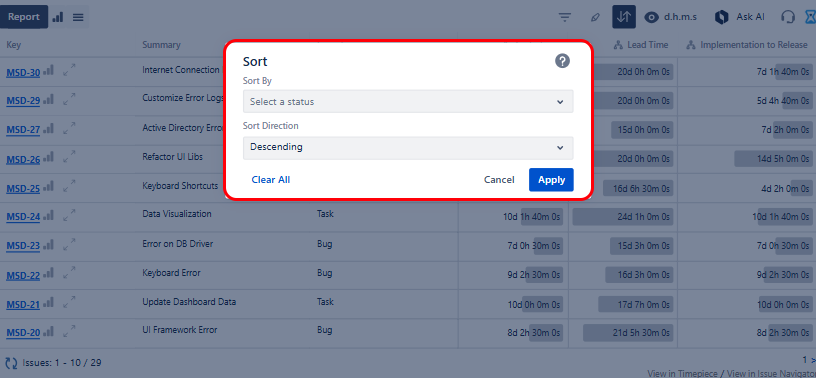
Sort
Highlight
Filter and Sort options are also available when you drill down to the details of an aggregate report.
The gadget will return to its configured settings when the page is refreshed
View Format
You can change the View Format (days, hours, minutes, etc.), enable/disable Data Bars, and show/hide Visit/Value Counts (for supported report types).
The gadget will return to its configured settings when the page is refreshed