
Business Need
Let's presume ...
You are using Jira for any kind of task tracking
Each of your Jira issues represents a piece of work that needs to be completed (It can be a software development story, a customer service ticket, a project task, or any other task to be tracked).
You have a customized workflow. A status in the workflow is used for issues that are waiting in the queue. Once the work on an issue starts, the workflow goes through multiple steps before being completed.
You want metrics like Lead Time and Cycle Time for your issues as described in this document here. But you also want to see the average times for those metrics and see the change for those average times (trend) over years, months, weeks, etc. You want to make a Trend Analysis.
Step 1
You can get this report either by using the Status Duration report type (with the Column Consolidation option ) or the Duration Between Statuses report type of Timepiece.
If you want to use the STATUS DURATION report type, you should...
-
Open the Timepiece reporting page.
-
Select the project in which the issues reside (or set any other filter to get the issues to report on).
-
Switch to STATUS DURATION report.
-
Click the Statuses button
-
Clear any already selected statuses if there are any.
-
Click on Add Consolidated Column button.
-
Enter the name Cycle Time for the new column.
-
Click Add Status button under your new column and select a status that should be included in Cycle Time.
-
Repeat the previous step until all statuses that should be under Lead Time are selected.
-
-
Add as many Consolidated Statuses as you link for additional metrics.
-
Use the Add Status button to add individual statuses to the report. You can add statuses, whether they are included in the consolidated columns or not.
-
Click Apply.
-
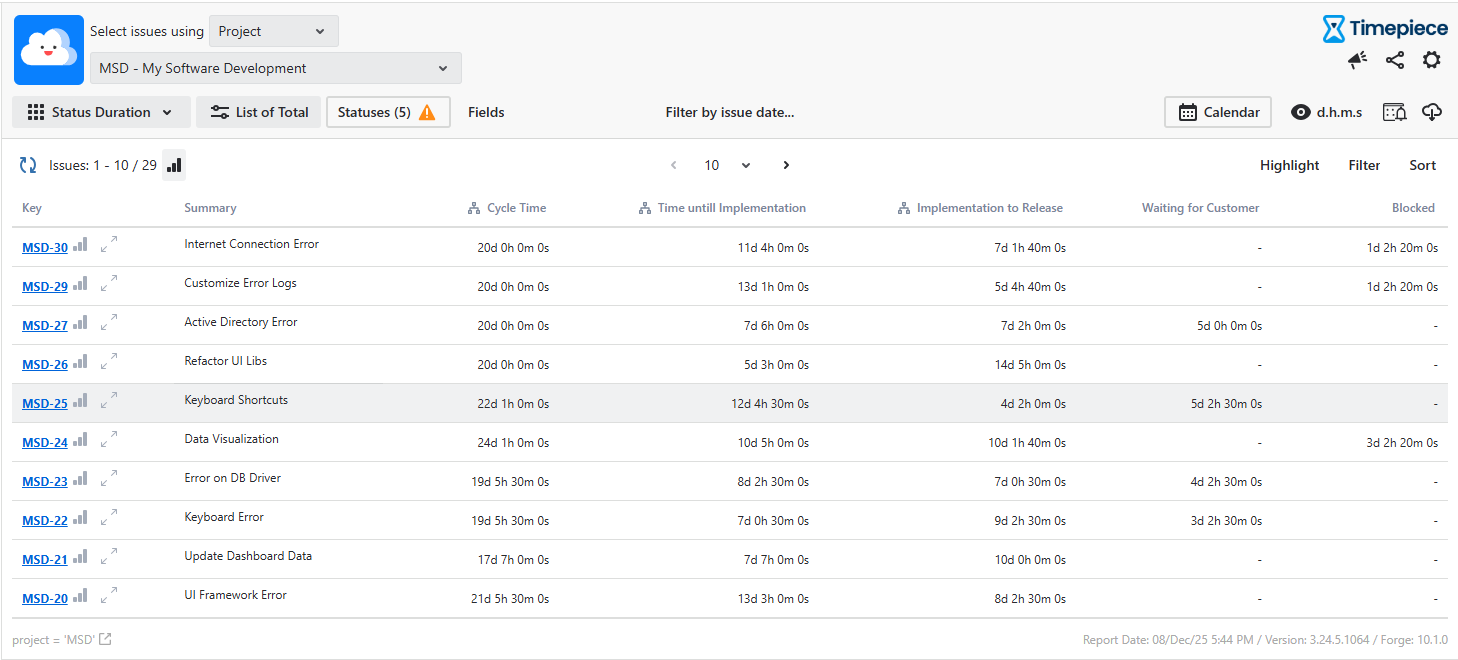
The report will show columns for Cycle Time, along with the other metrics and statuses you selected.
You can see the Statuses page for details about selecting statuses and creating Consolidated Columns.
You can watch this training video to see how status selection is made and how Consolidated Columns are created.
If you want to use the DURATION BETWEEN STATUSES report type, you should...
-
Open the Timepiece reporting page.
-
Select the project in which the issues reside (or set any other filter to get the issues to report on).
-
Switch to the DURATION BETWEEN STATUSES report.
-
Click the Metrics button
-
Clear any already selected metrics if there are any.
-
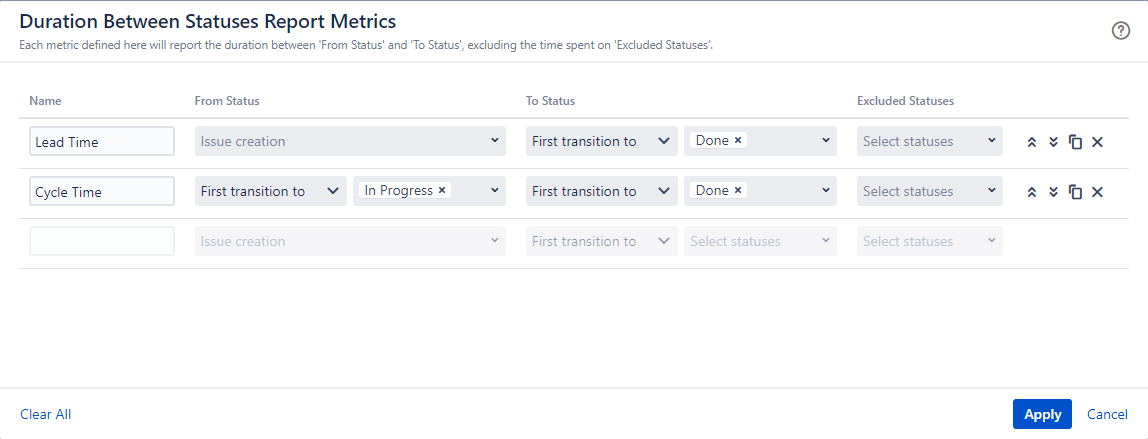
Create a new metric with the name Cycle Time.
-
Select In Progress as the From Status.
-
Select Done as the To Status.
-
-
Repeat the previous steps for any other metrics that you want to create.
-
Click Apply.
-
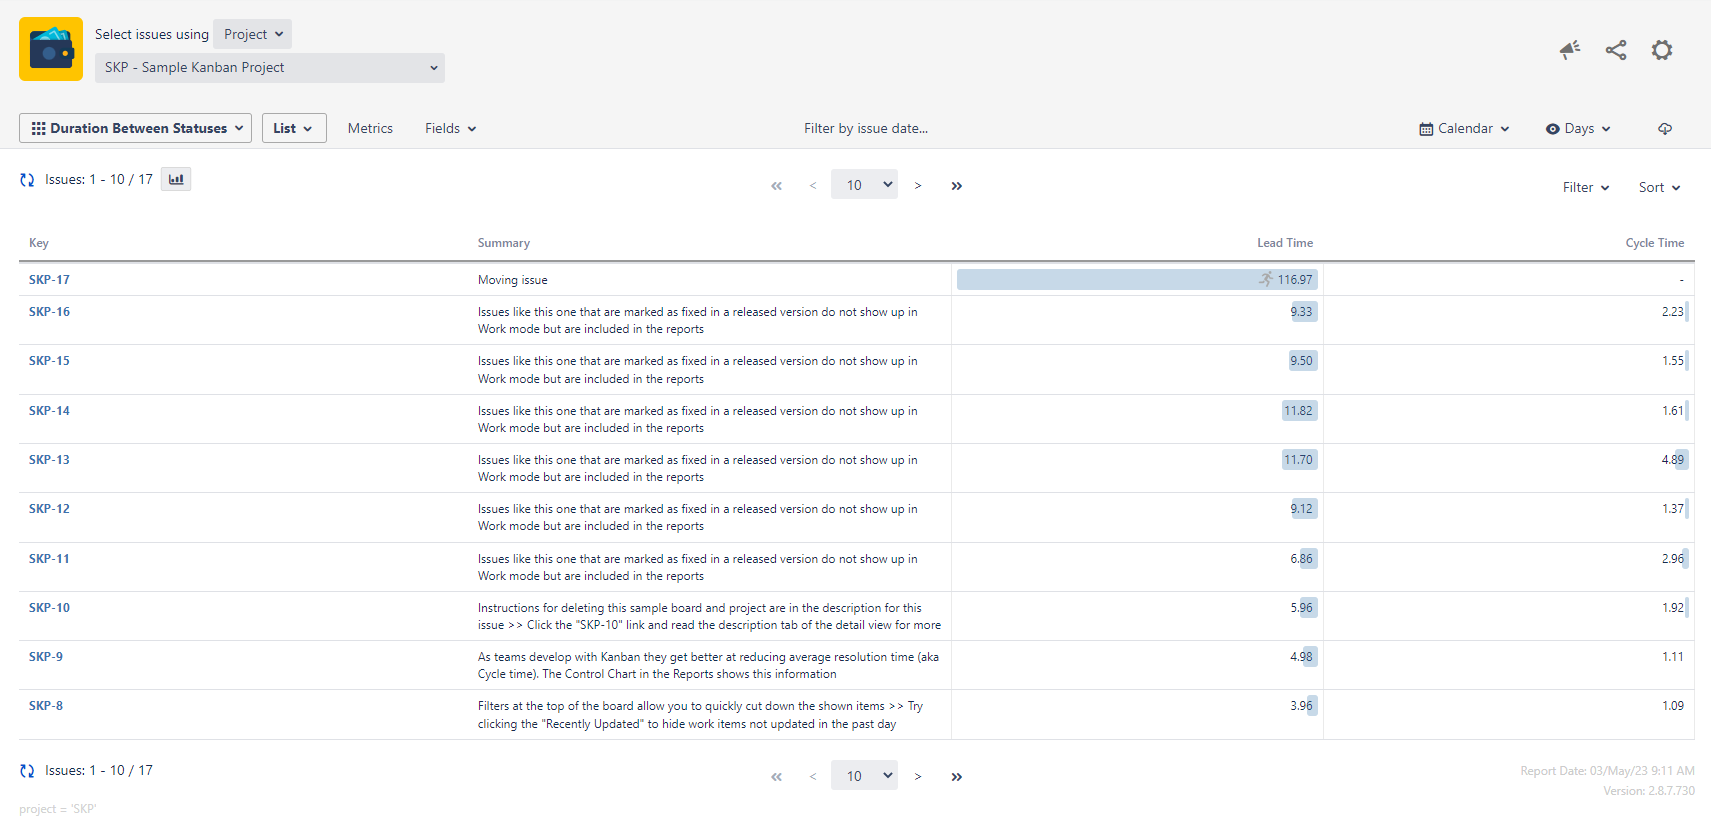
The report will show a column for Cycle Time, along with the columns for other metrics you defined.
You can see the Metrics documentation page for details about creating metrics.
Step 2
Then you should switch to an Average report and use date field components to group your issues. (The example continues based on Status Duration report)
-
Open the Report Options panel.
-
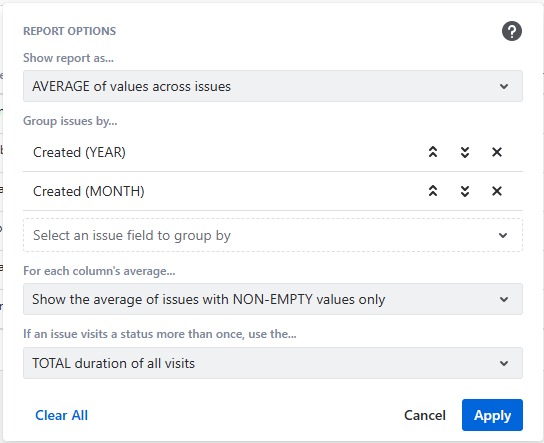
Change the “Show Report as” option to AVERAGE.
-
Make a selection for the Group By fields.
-
You will see that all date fields (including system and custom fields) are listed with their components (Year, Quarter, Month, Week, Day, Hour) in the Group By fields list.
-
Add the Created (YEAR) and Created(MONTH) options to the selection. (In this example, we are using the Created Date field, but you can do the same for any date field)
-
Click Apply.
-
You will now see that Timepiece will group the issues in your project by week (of create date) and display the average for each group in a separate row.
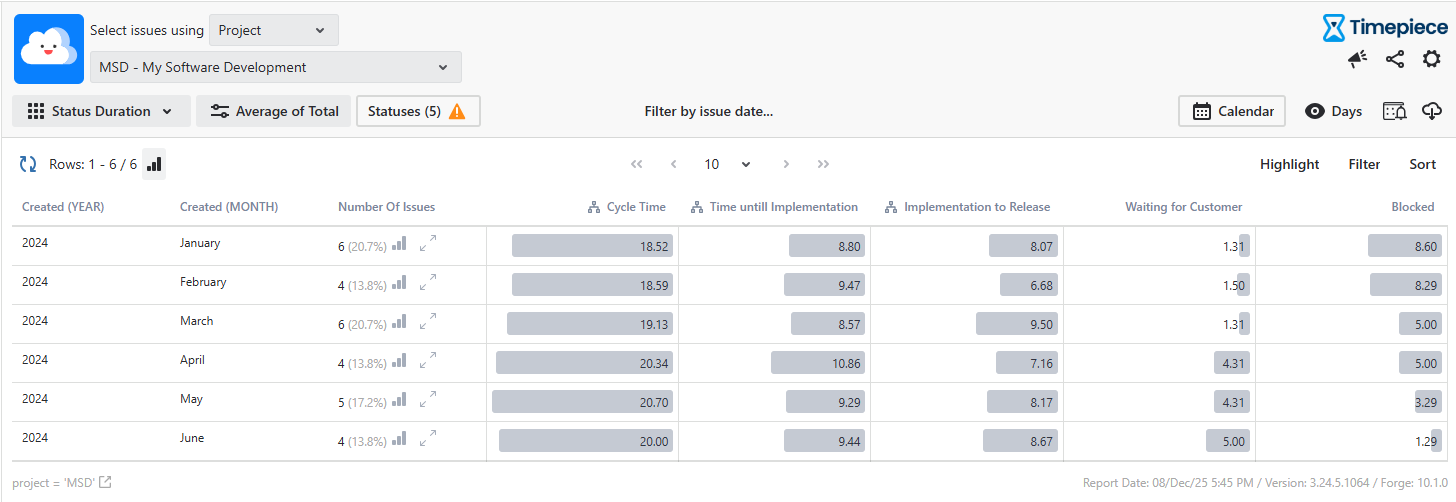
Here, you will be able to see the trend for each metric over months. You can change the date grouping to see the yearly, monthly, weekly, daily or even the hourly trends.