Business Need
You need an automated process that detects when an issue is flagged, gathers its status times data using Timepiece, analyzes the value with Rovo, and automatically posts a comment including a root cause analysis and status duration summary.
Solution
“STATUS DURATION” report type of Timepiece, combined with Jira Automation & Rovo, can be used for this purpose.
Step 1: Configure and Save the Timepiece Report
First, create a Timepiece report...
-
Open the Timepiece reporting page.
-
Select the project in which the support issues reside (Let’s presume you have selected the ABC project).
-
Any filter selection at this point works. The selection made at this stage is not critical, as it will be overridden later during the automation configuration.
-
-
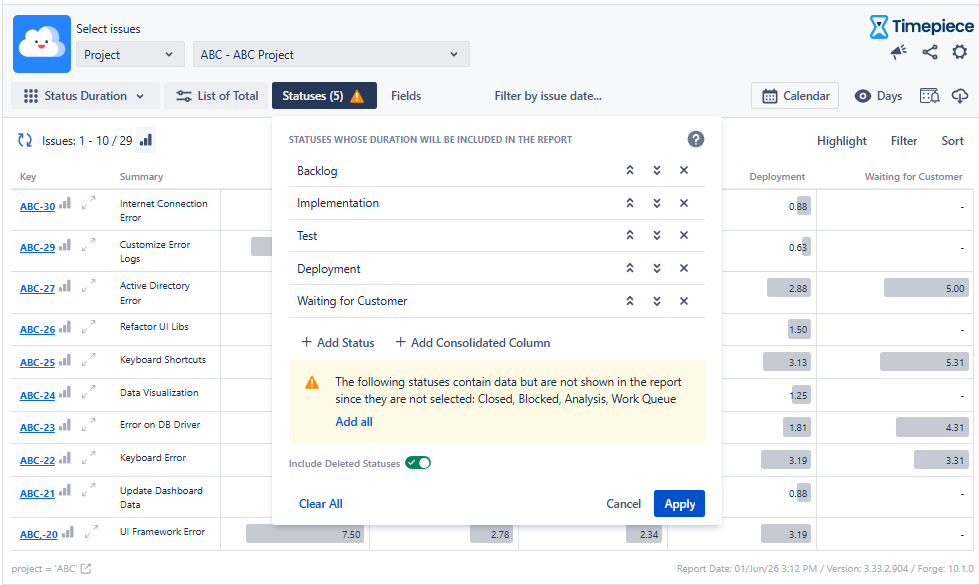
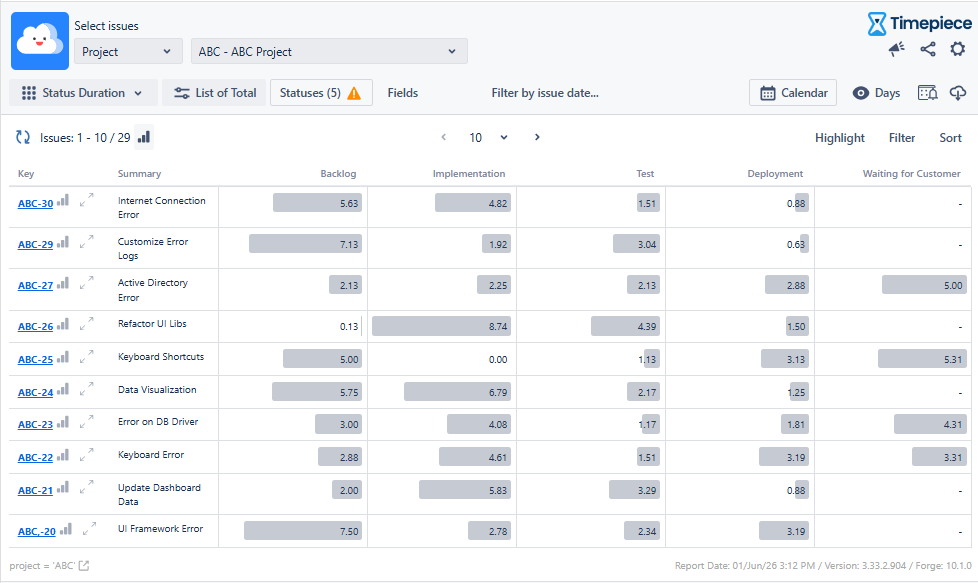
Switch to the “STATUS DURATION” report type.
-
By default, all statuses are included. If you want to filter by specific statuses, you can select them as shown below.
-
(Optional) Select your business calendar if you have one.
-
Go to settings and save it via "Save report parameters".
-
The parameter set name should be like "ABC Project Status Duration Report".
-
Make sure you select the "Share with everyone" option so others can use the param set as well.
-
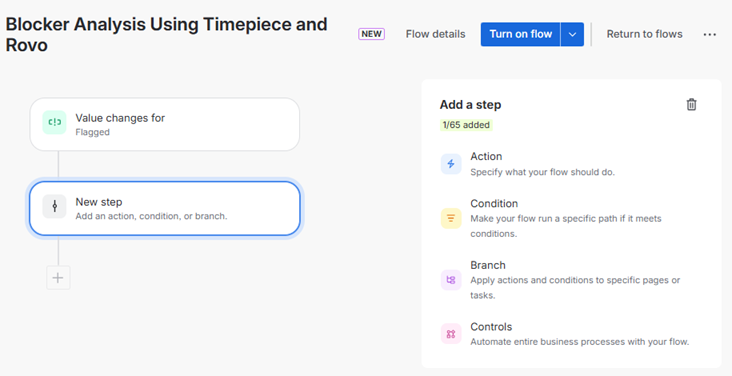
Step 2: Create a Jira Automation & Set General Flow Details
Navigate to Jira Automation and start a new rule.
Before configuring the automation logic, you must define the administrative settings in the Flow Details section.
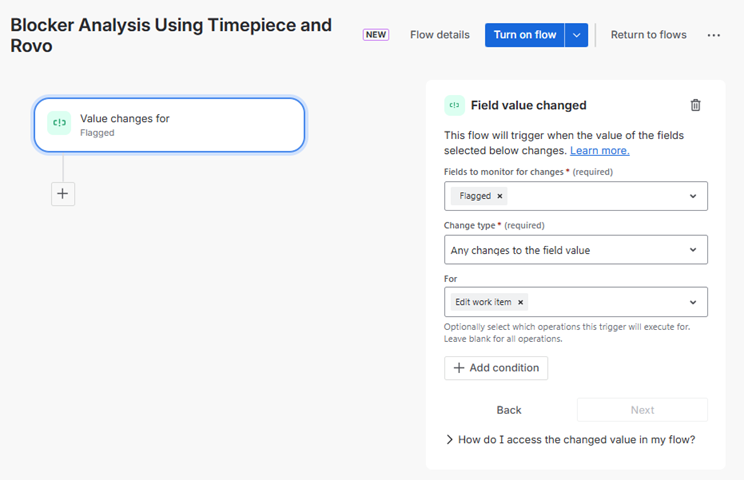
Step 3: Define Trigger and Conditions
Use the “When: Value changes for Flagged” trigger to start the automation whenever an issue is marked as flagged. Since the automation is designed to generate an analysis and add it as a comment under the issue when it becomes blocked, the automation starts with this specific transition.
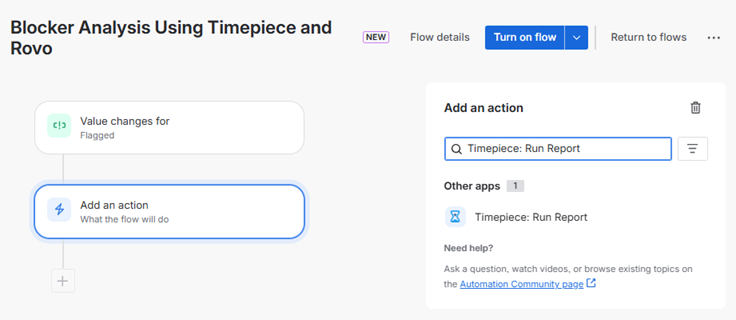
Step 4: Add Action - Timepiece: Run Report
After defining the trigger and conditions, add a “Timepiece: Run Report” action that will fetch the required data from Timepiece.
Select the report (Parameter Set) you created for this automation in the Report Settings field. Ensure that the report has been previously saved using the “Save Report Parameters” option.
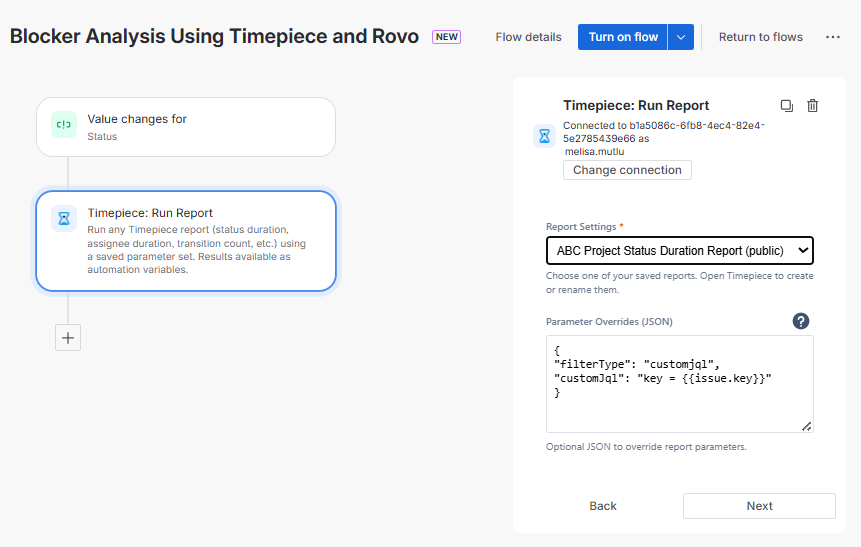
Parameter Overrides
Override some report parameters with a custom JSON. We’ll override the report filter so it returns data only for the issue that triggered the automation, defined as ({{issue.key}}). The automation ensures it fetches the status duration for that exact issue rather than a general dataset.
Parameter Overrides: { "filterType": "customjql", "customJql": "key = {{issue.key}}" }
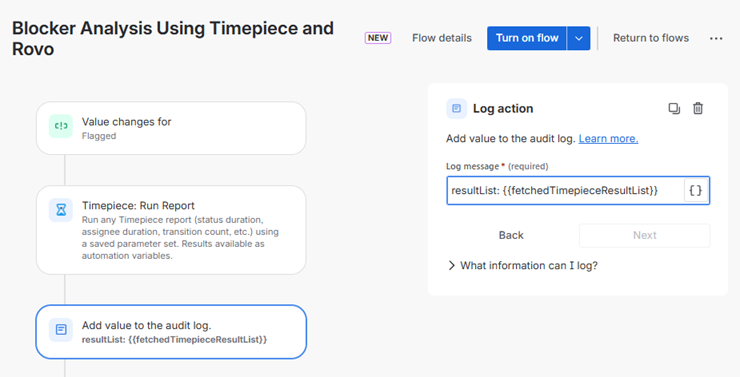
Step 5: Add Log Action (Optional)
Add a Log Action to your flow. This step is necessary if you want to monitor the automation and is helpful for debugging in the event of an error.
This action writes the entire dataset returned from the report as a log output, allowing you to see all available data at once.
Log Message: resultList: {{fetchedTimepieceResultList}}
Note: For more details about the logging and debugging, see the documentation.
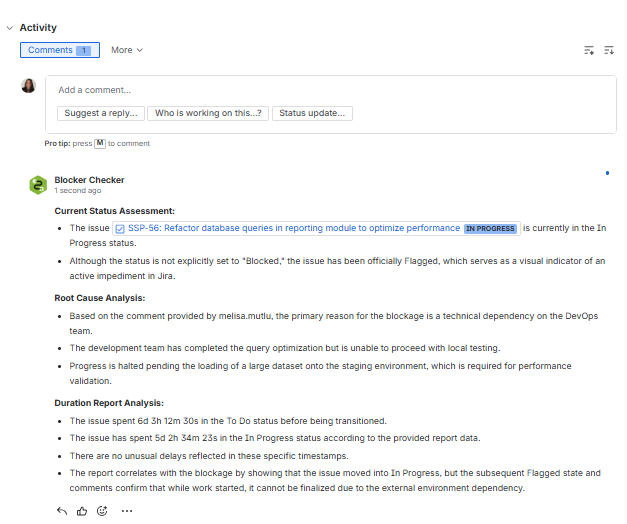
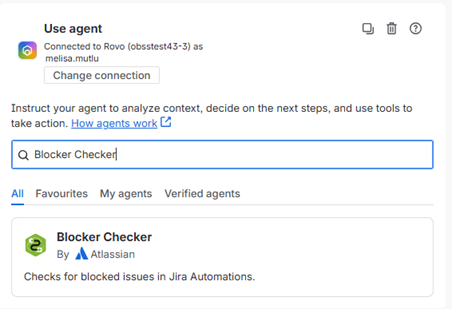
Step 6: Use Agent (Blocker Checker)
In this step, we pass the data from Timepiece directly to the AI agent. Using the prompt we provide, the agent acts as a Senior Project Manager and Data Analyst to perform a detailed root cause analysis by examining both the issue comments and duration data to identify the factors causing the blockage.
The analysis is stored in the {{agentResponse}} variable, so it should be used in the final step.
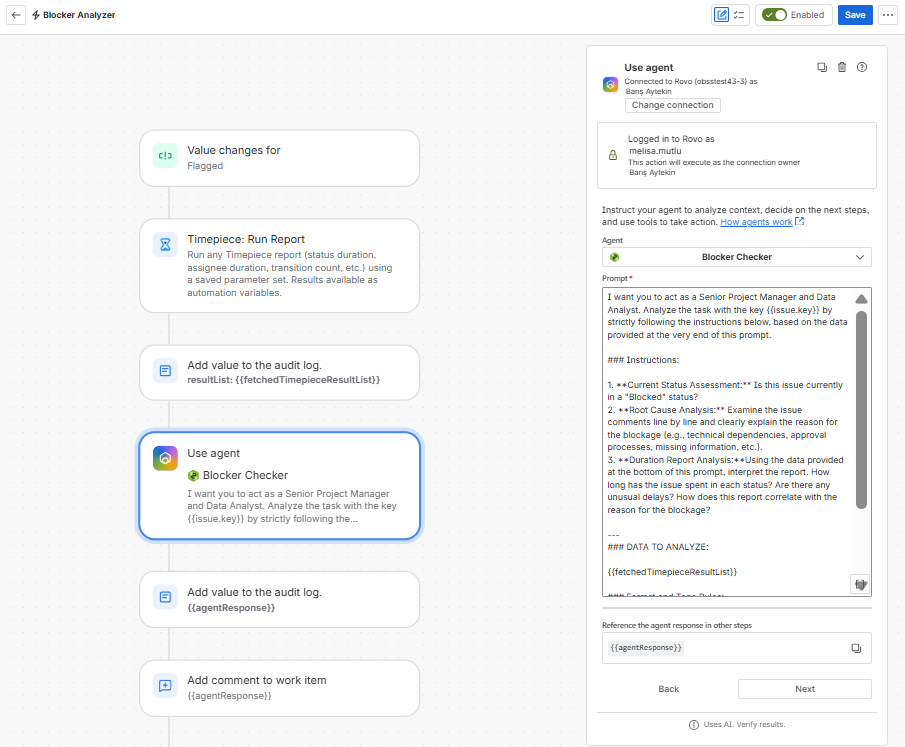
{{issue.key}}: Included to ensure the agent identifies and analyzes the correct work item.
{{fetchedTimepieceResultList}}: Provided so the agent can interpret the actual duration data and status transitions.
Step 8: Comment on work item
In the Comment on work item step, we post the final results directly to the issue as a comment. By using the {{agentResponse}} variable, the findings regarding the blockage and the duration data from Timepiece are added directly to the work item.
Add a comment for this automation: {{agentResponse}}
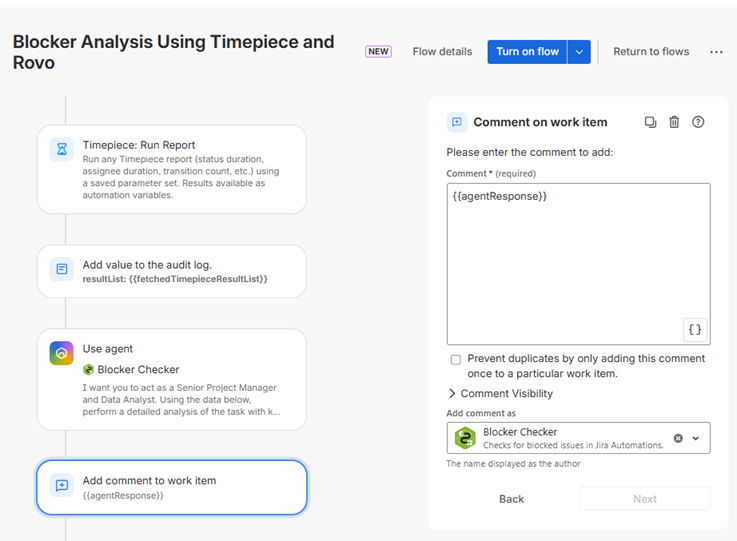
Step 9: Enable the Rule
Click the "Turn on rule" button to activate the automation. In this final step, the automation automatically posts the analysis generated by the AI agent as a comment when an issue is flagged.